GuideHow to use X-RayEvery part, in plain words
Learn X-Ray, part by part.
How to read the chart, the book and every candle; how to draw, set alerts and trade from the chart. Real screenshots of the app, and the keys for all of it. Read it top to bottom, or jump to what you need.
Fig. 1X-Ray, member view · BTC 5m · Wed 18 Nov 2026, live, the 14:45 UTC candle open in Candle X-Ray · as captured
01Start
Getting started.
One MRX account opens X-Ray. Make one free on mrxtrade.com and confirm your email, then Account → Open X-Ray: it opens in a new tab, already signed in. Or go straight to app.mrxtrade.com.
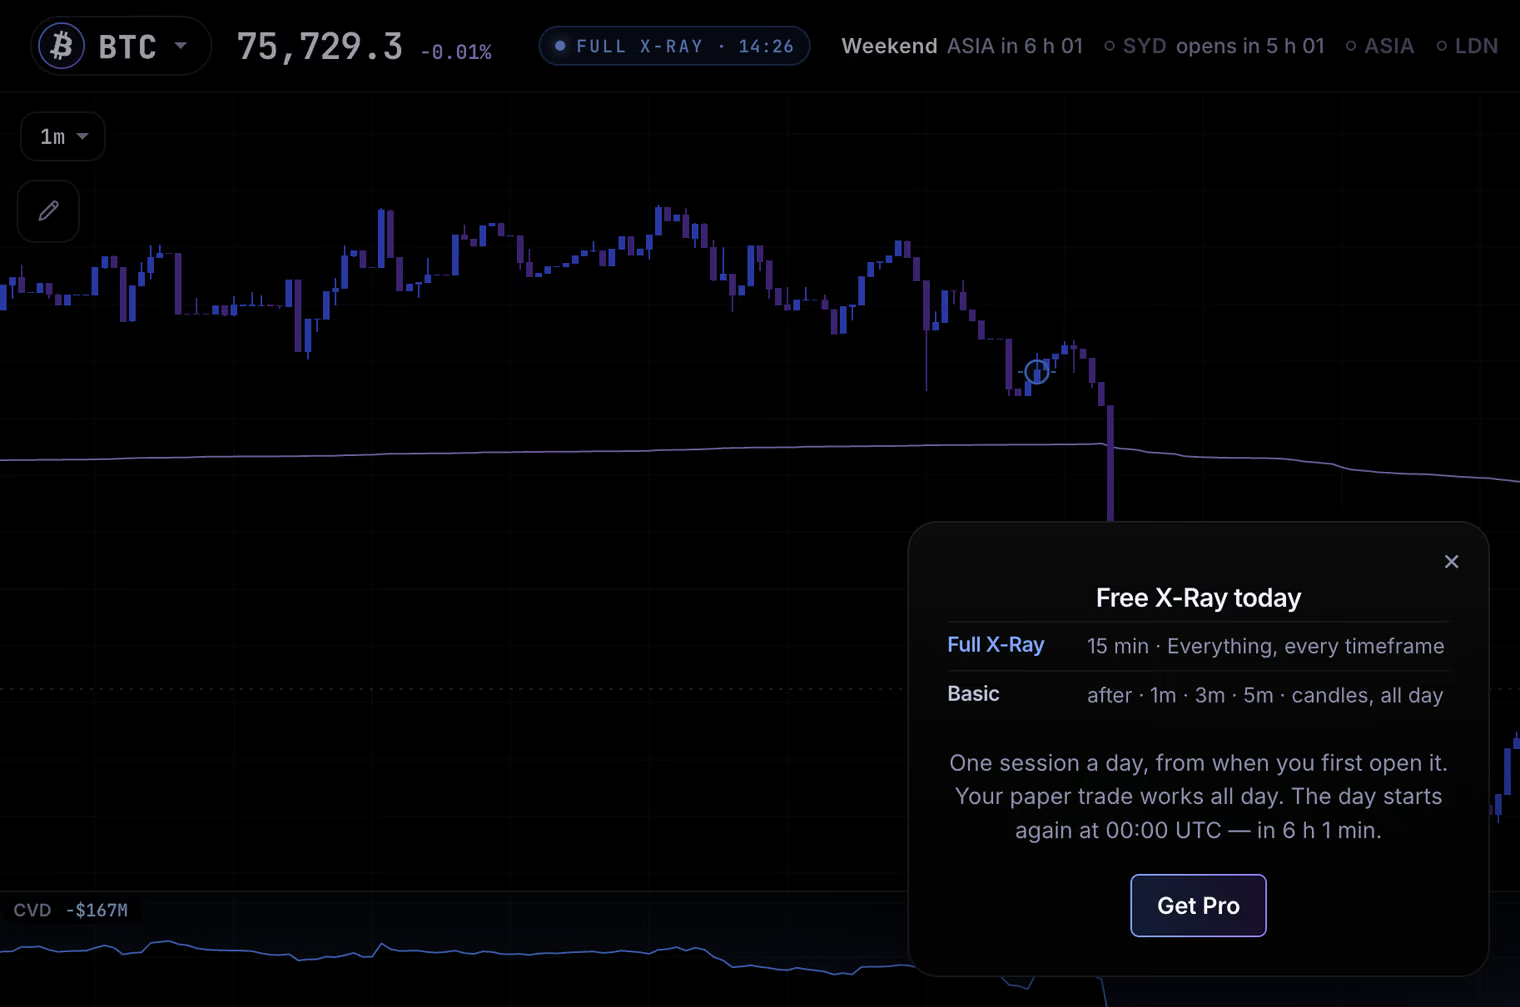
Free: fifteen minutes of full X-Ray a day
A free account gets one session of full X-Ray a day: 15 minutes, from the first time you open X-Ray that day. The chip beside the price counts it down (FULL X-RAY · 14:31); tap it to see your day.
- The clock runs from the moment the session starts, even if you close the tab. A new tab or another device carries on the same session.
- After it: Basic for the rest of the day, candles on 1m, 3m and 5m. The book, Candle X-Ray, the flow panes, the bubbles, the drawing tools and screenshots wait behind a lock.
- A new day starts at 00:00 UTC.
What stays free all day
The Proving Ground (paper trading on a $10,000 account), your trade plan on the chart, and your journal.
Full X-Ray on a free account is Bitcoin, with 40 days of history. Alerts and X-Ray Read are Pro.
Pro: everything, all day
Every coin X-Ray has, all of its history, alerts, and trading from the chart with your own exchange account. $49 for 30 days, or 3, 6 or 12 months for less a month; the first 100 founding members pay $29, 40 % off for life. Paid in USDT or USDC.
Install it as an app
- Chrome or Edge (computer or Android): the Install X-Ray chip, then Install.
- iPhone or iPad (Safari): Share, then Add to Home Screen.
- It opens full screen, like an app. When we ship a new version, a New version — tap to reload chip shows.
Sign-in
One sign-in for the site and the app: a passkey, an email code or a wallet. Every account confirms an email before it opens X-Ray. Signing out of X-Ray signs you out of both.
02Start
One window, every part.
The chart in the middle, the book on the right, and the Lightbox, one drawer that slides in beside the chart. Fig. 1 at the top of this page names each part; tap a number to jump to it.
The header
The coin (tap it for the list: BTC, ETH, SOL, HYPE, ZEC, XRP) and its price, with the change over the last hour. In the middle, the sessions: Sydney, Asia, London and New York, lit while they are open, with the next open; tap them for the Market Clock (C). Then your account and the Lightbox button.
The toolbar
The timeframe at the left, the pencil under it for the drawing tools. On the right: Long and Short, the Keys switch for the trading keys (with an account that trades), the camera to share a screenshot, and full screen (M).
The Lightbox
One drawer, six tabs: Candle X-Ray (F), Trade (D), Alerts (A), Journal, Portfolio and Tools (K). X opens and closes it, [ ] step through its tabs, Esc closes it.
Under the chart
Four flow panes: CVD, open interest, delta and liquidations. On the right, the book, with the tape speed over it.
Two charts, more windows
Tools › Layout › Charts: Split puts a second chart beside the first, with its own timeframe, as candles or footprint. Pop out moves the book or Candle X-Ray into a window of its own that follows this one. Saved layouts keeps up to 12 named layouts in your account.
Duo, on a foldable iPhone
Unfold a foldable iPhone and X-Ray switches to Duo by itself: the chart full width, and once you open the Lightbox, Candle X-Ray and the book side by side beside it. Fold it and the Lightbox closes; unfold it and it opens again if you left it open.
X-Ray opens in up to six windows at once on one account (a pop-out counts as one). A seventh asks you to close the others.
03Start
X-Ray in your pocket.
The same app, laid out for one hand: the chart on top, a dock along the bottom, and sheets that slide up over the chart.
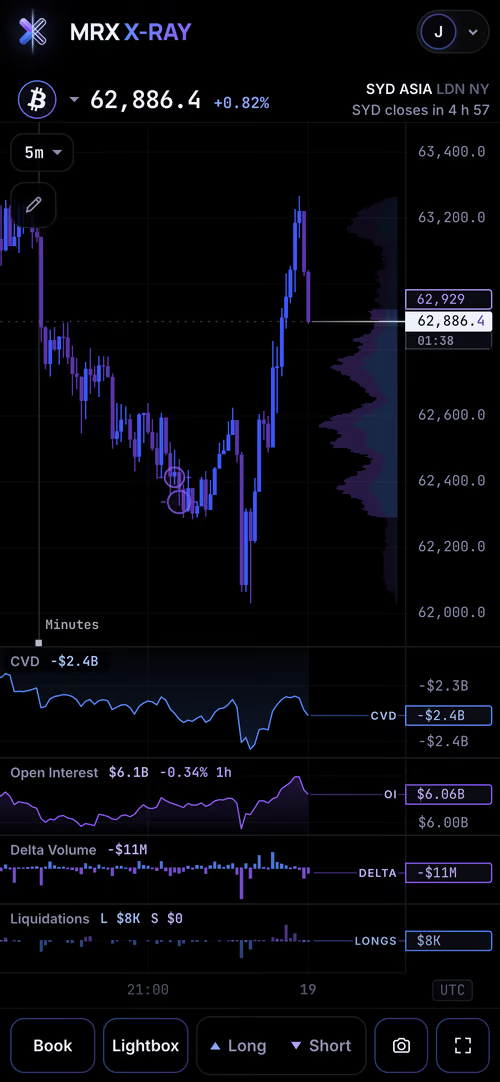
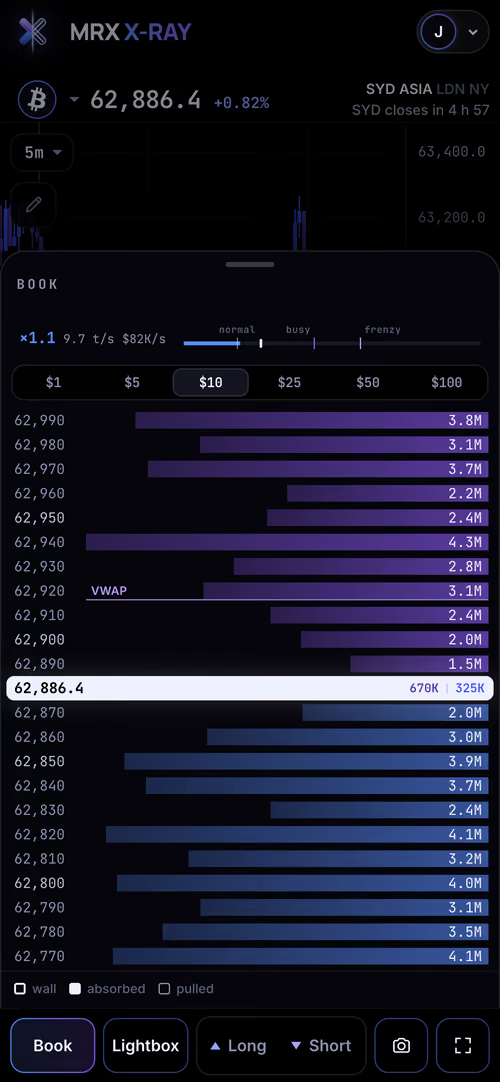
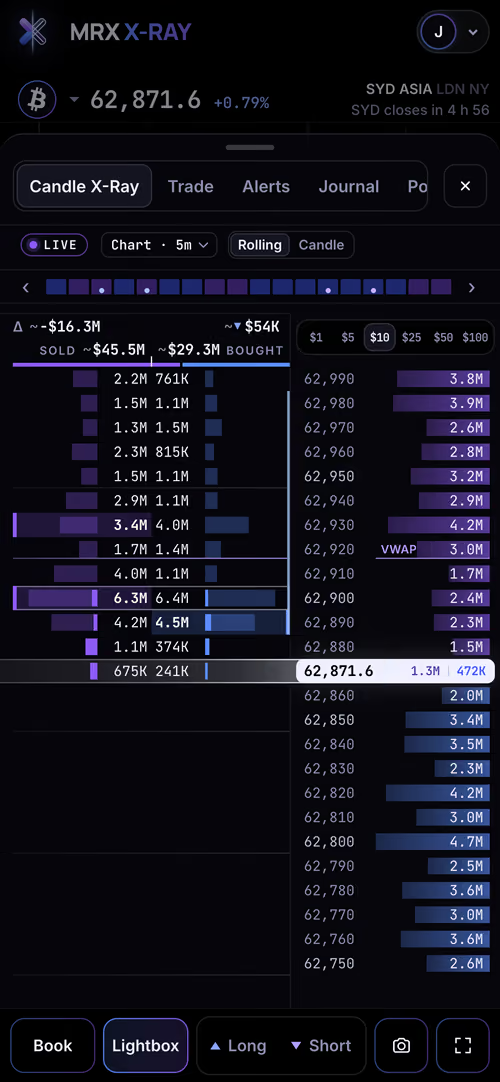
The dock
Book and Lightbox open their sheets; Long and Short plan a trade at the price; the camera shares a screenshot. The last button is full screen, and on an iPhone Chart mode: the chart to every edge, with the header, the dock and the book out of the way until you tap back.
Moving around
- Tap a dock button, or swipe up.
- Swipe sideways to go from the book to the Lightbox, or to its next tab.
- Swipe down, or tap outside a sheet, to close it.
- A tap on a candle moves the crosshair; Candle X-Ray opens from the dock. Swipe its candle strip to step from candle to candle.
- With a plan or a position on the chart, a long press opens the trade menu.
04Read the market
The chart and its timeframes.
Blue candles closed up, purple closed down. Times read in UTC to start (Tools › Time switches them to your own time, or any zone), and the tag on the price axis carries the price and the time left in the candle.
Pick a timeframe
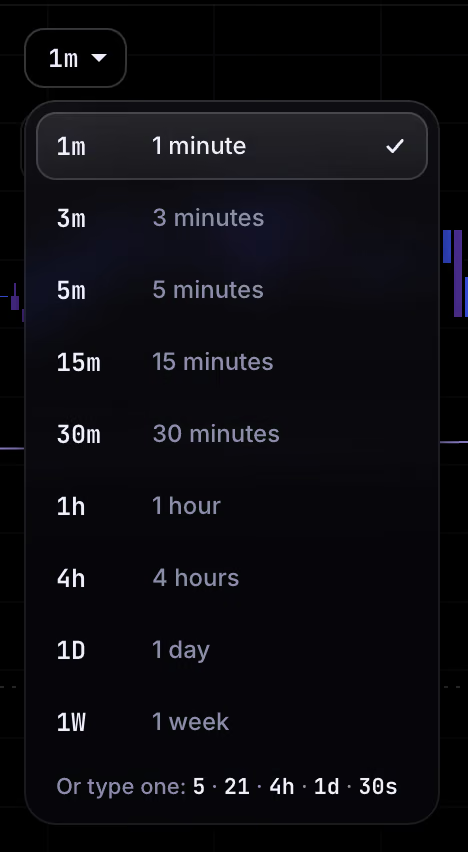
Tap the chip at the top left: 1m 3m 5m 15m 30m 1h 4h 1D 1W.
Or just type one, anywhere on the page: a number, then m h d w or s for seconds. 5 is 5 minutes, 4h is 4 hours, 30s is 30 seconds. ↩ takes it, or wait a moment. Your last eight typed timeframes stay in the list, under Yours.
Move around
- Drag to pan; scroll or pinch to zoom.
- Drag an axis to stretch it. Double-click the price axis to put it back on auto, the time axis for the usual view.
- ⇧ + drag a box to zoom into it, on a lower timeframe when it needs one; Esc or ⌫ steps back.
- ⌥R resets the whole view.
Right-click
View footprint (V) draws every candle as its footprint, with its numbers under it. Also: add an alert at a price, reset a pane, remove a drawing, and with a plan or a position on the chart, trade from the menu.
Your time
Tools › Time: UTC (the start), My time, or any zone, kept on this device. It changes the axis, the crosshair, Candle X-Ray, the book and your fills; candles, sessions and the VWAPs still run on UTC days.
Session lines (where Asia, London and New York open) and Release lines (the big economic releases) are in Tools › Sessions; switch them on there.
05Read the market
The book: what is waiting.
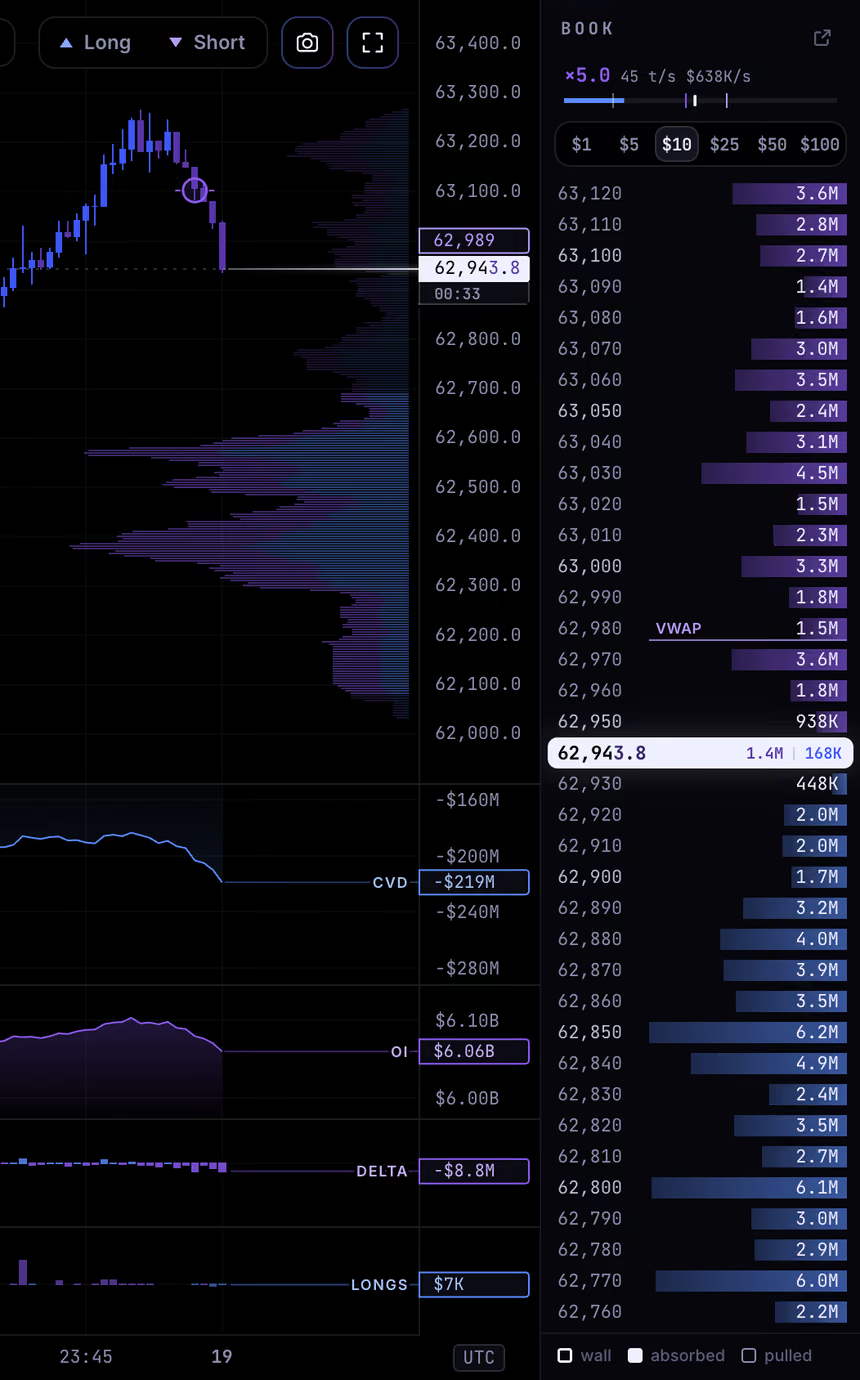
The orders resting above and below the price, in dollars: asks above in purple, bids below in blue, and in the middle the price row, with what rests to sell and to buy inside it.
Rows
Pick the size of a row in the book's header: $1 · $5 · $10 · $25 · $50 · $100 (we start you on $10). Each row shows the dollars resting in it; the bars are scaled to the biggest.
Walls
- WALL
- One price with $10M or more resting (on Bitcoin; other coins scale it to their own book), once it has stood the minutes Tools › Walls › Real only asks for (10 by default). BIG WALL from $20M.
- ABSORBED
- Traded into until it was gone.
- PULLED
- Cancelled before price got there.
An ended wall fades out over ten minutes.
Level rows
Your lines and rays, the VWAPs, an extended profile's POC, VAH and VAL, your alerts, and your trade's entry, stop and targets show in the book as named, underlined rows.
Tape speed
Over the book: how busy the tape is against its usual pace (×1.8 is 1.8 times the last half hour's), trades a second and dollars a second. The ↗ in the header pops the book out into a window of its own.
06Read the market
Candle X-Ray: inside the flow.
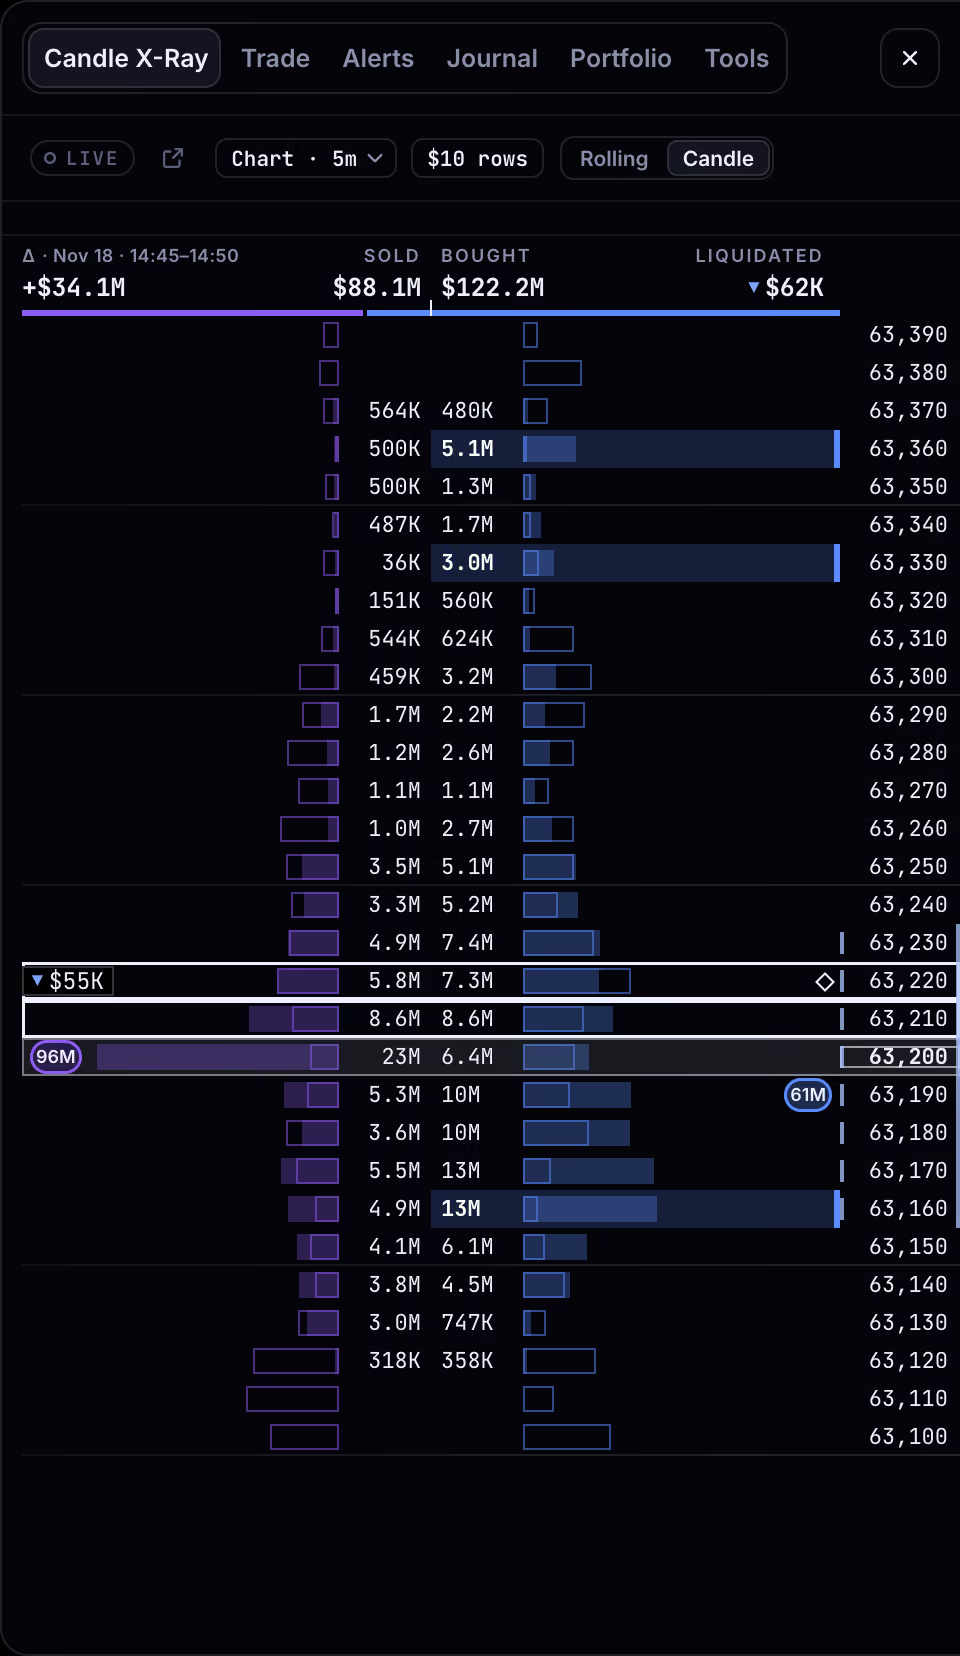
Every price inside the last few minutes, or inside one candle: what sold, what bought, what was liquidated, and where it was absorbed. In dollars, row by row.
Rolling or one candle
The switch beside its timeframe picks how it reads. Rolling (the start) shows the last few minutes, sliding as they go, so nothing resets at a candle's close; while the window fills, its totals read ~ and filling. Candle shows one candle, with the one before it as a faint outline. This device keeps your choice.
Open a candle
- Click a candle (or a bubble) on the chart.
- Or press F, or ⌥-click any candle on any pane.
- ← → step candle to candle (⇧: five at a time).
Read it
The heads carry the totals: Sold, Bought and their difference, the delta, over the window (Last 5 min) or the candle. Under them, a row for every price: sold in purple, the price, bought in blue. The bright tip of a bar is what traded there in the last 15 seconds. A liquidation of $25K or more is a chip at the end of the side it hit: longs on Sold, shorts on Bought.
Rows are $10 on 1m–5m, $25 on 15m–30m, $50 on 1h, $100 on 4h, $250 on 1D and $1,000 on 1W; a long candle gets wider rows. Tap a wide row to open its finer rows.
The marks
- Imbalance
- Bought at least 3 times what sold one row below, and at least $1M (more on longer candles): the cell lights up.
- Stacked
- Three or more imbalances in a row, edged.
- Absorbed
- Big trading at the high or low that price couldn't push through. On one candle, after the next one it reads held or failed; in Rolling it is drawn dashed, with no verdict. None on 15m.
- POC
- A white hairline: where it traded the most. The thin blue line is its value area; a small diamond, the last candle's POC.
The wing
With the book on, Candle X-Ray's rows dock onto the book's left edge, on the book's own price rows, wherever its rows fit the book's step: what traded and what rests, on one line. That is where the held glow shows.
↗ pops Candle X-Ray out into a window of its own.
07Read the market
Volume bubbles: big prints.
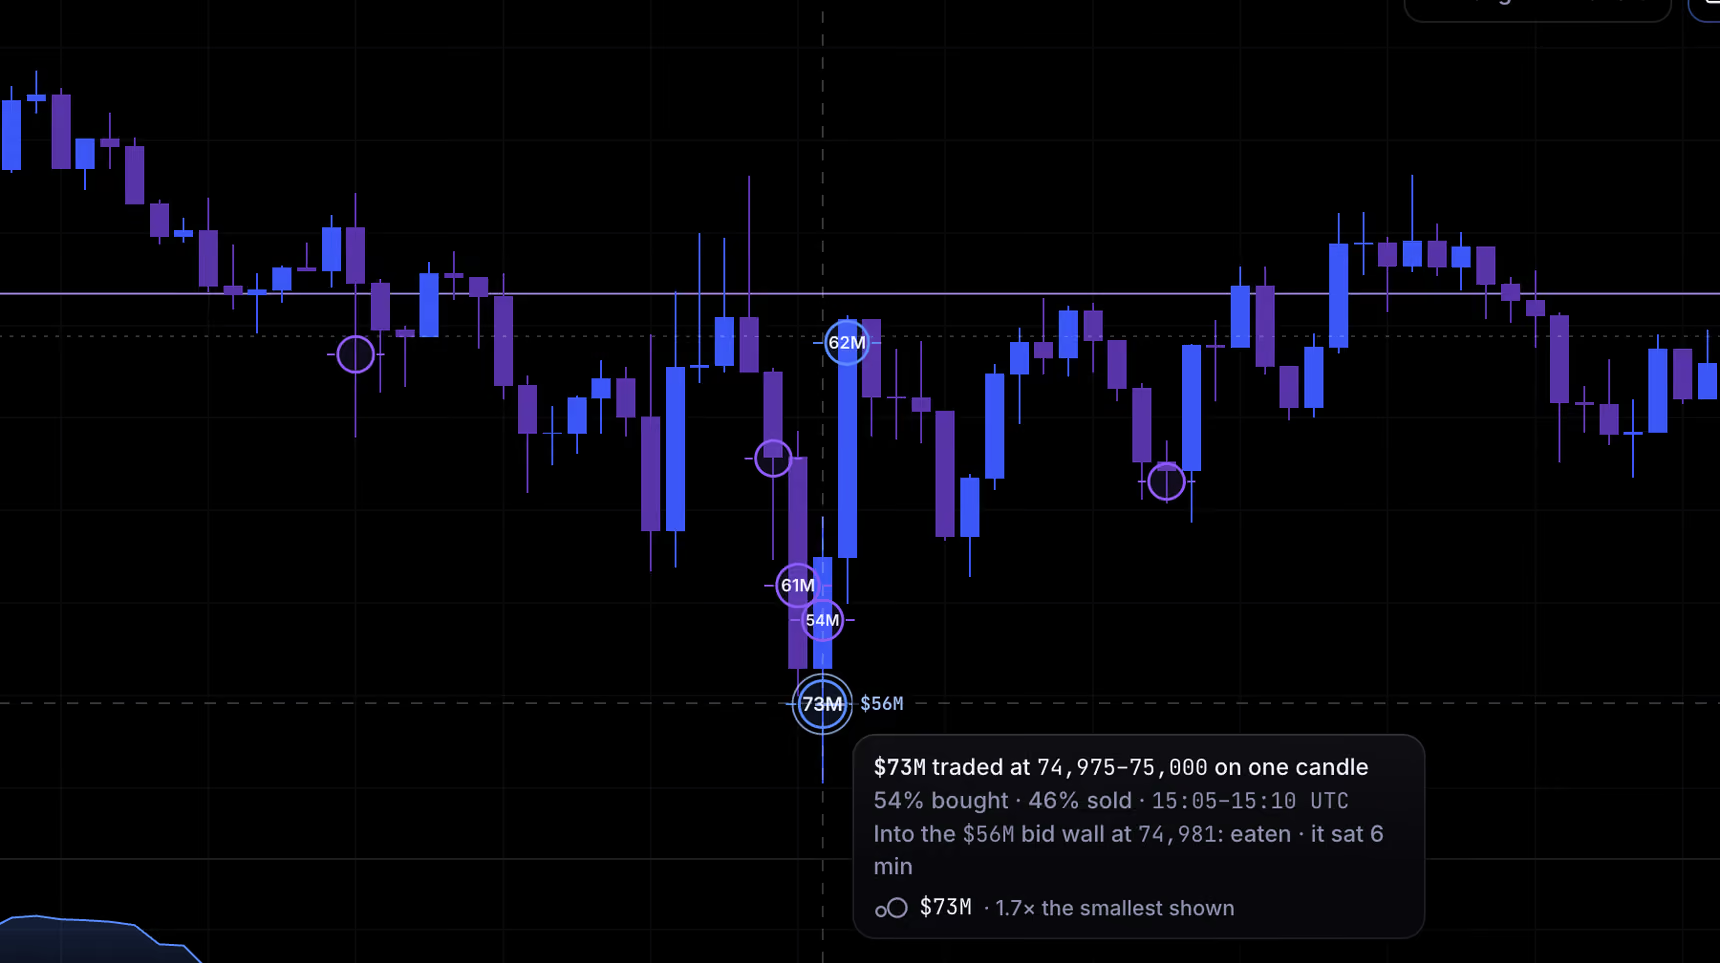
A bubble is big volume at one price: everything that traded in one price band of one candle, both sides together. Sized in dollars, the same size at any zoom.
Colour and size
Blue when more was bought, purple when more was sold. The dollars show inside when the bubble is big enough to hold them.
Which ones show
Visible range (the start): bubbles over the minimum (from $5M on 1m, about $18M on 5m, $45M on 15m) and at least 30 % of the biggest on screen, twelve at most. So they change as you zoom.
Fixed $ (Tools › Prints) keeps one dollar size instead. Both have a Minimum slider.
Tap one
A click opens Candle X-Ray on that candle, with the bubble's row outlined and named on the price axis.
Timeframes
On from 1m to 15m. On 30m, 1h, 4h and 1D switch them on for that timeframe in Tools; there are none on 1W.
08Read the market
The flow under the candles.
Four panes under the chart, all in dollars, all on the chart's timeframe.
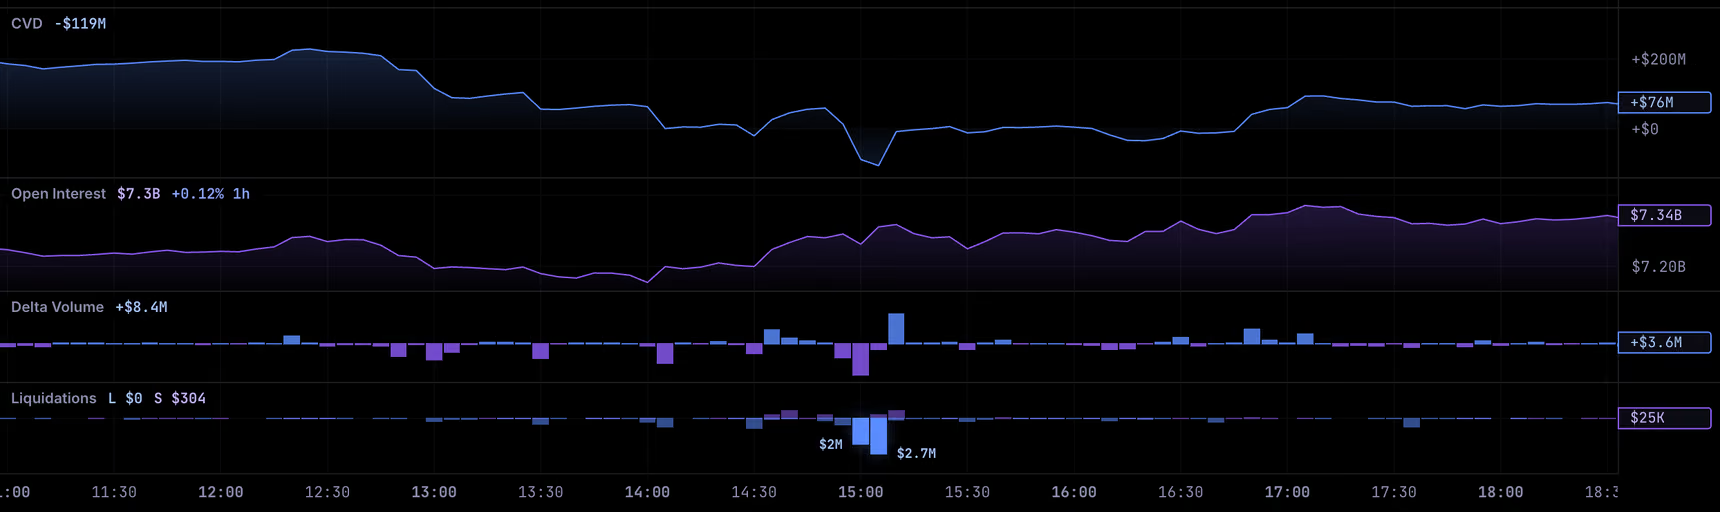
- CVD
- The running total of every candle's delta (bought minus sold), from the first candle on the chart. Scroll back and it starts again from the new first candle.
- Open interest
- Every open position in dollars. Its legend adds the change over the last hour.
- Delta volume
- Each candle's bought minus sold: blue up, purple down.
- Liquidations
- Shorts liquidated stand up in purple, longs liquidated hang down in blue. Bars of $1M and more glow; the three biggest are labelled.
Tools › Panes switches each one on or off. Drag the line between two panes to resize them; right-click a pane, or double-click its scale, to reset it.
09Read the market
Levels, and the held glow.
The prices that matter, drawn for you or by you, and a glow in the wing that shows how long price has been sitting on one.
VWAP
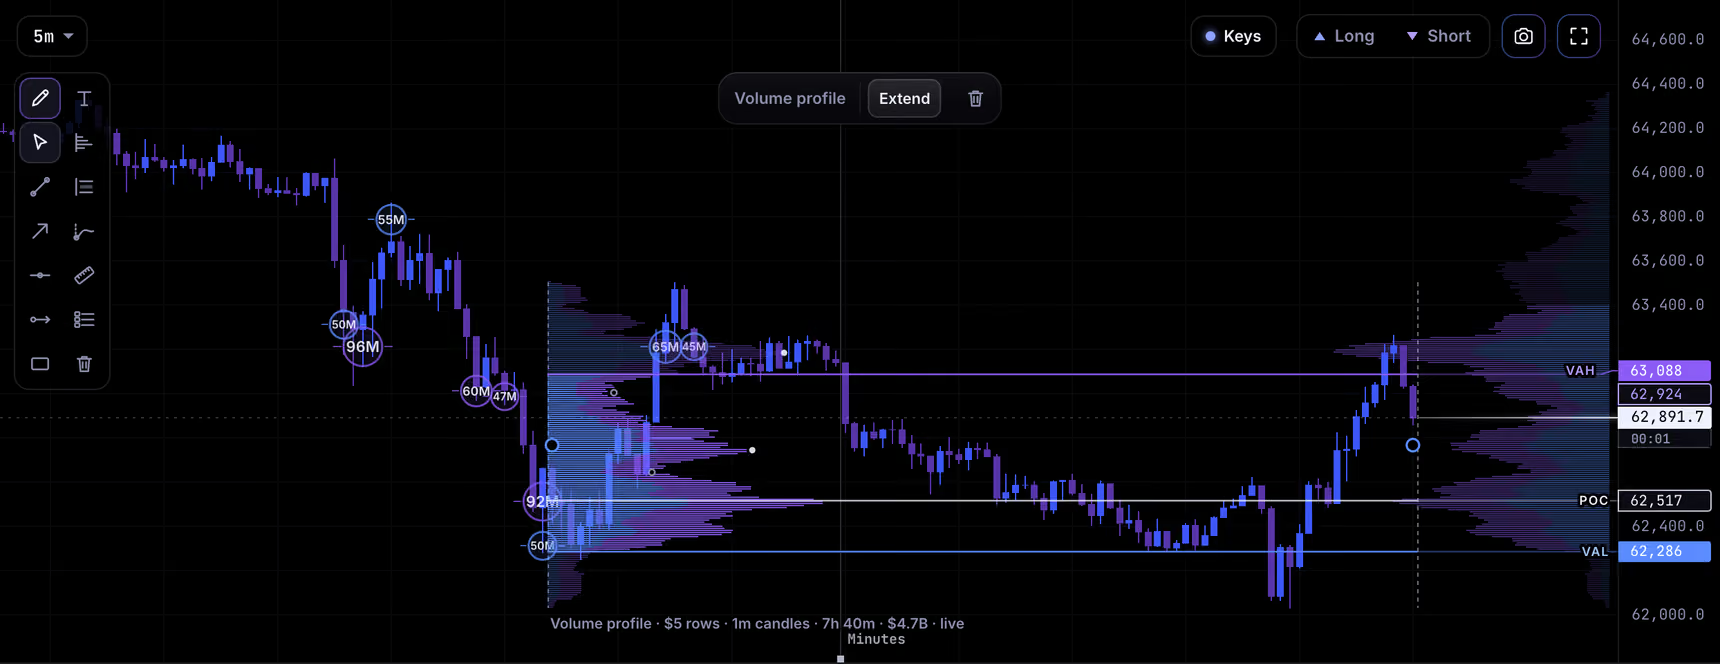
The daily VWAP (from 00:00 UTC) is on from the start up to 15m: a lavender line on the chart and a row in the book; switch it on for longer timeframes in Tools › VWAP. Weekly and monthly VWAPs are there too.
Volume profiles
Fixed range: ⌥V, then drag from the first candle to the last. It draws the POC (white: where the most traded), the VAH (purple) and VAL (blue), the edges of the area holding 70 % of the volume, and dots for the high and low volume nodes.
A new profile is extended to the live candle, so its lines join the book; select it to switch that off, or to remove it. Visible range (on from the start, Tools › Volume profile) shades what traded at each price on screen, behind the candles.
The held glow
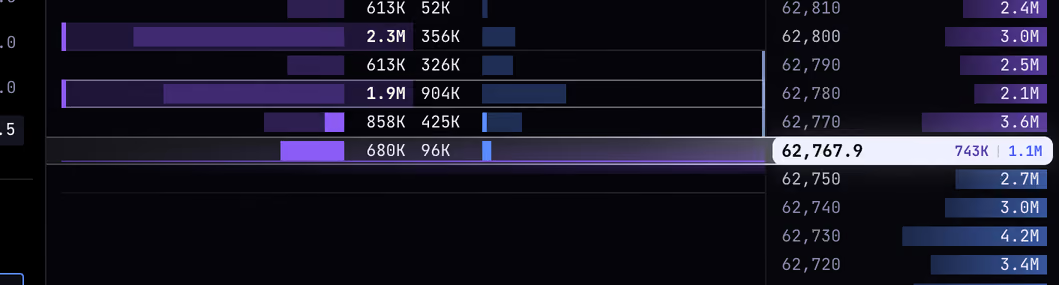
When price sits on a level, that level's row lights up in the wing, in the level's colour, and grows from the book's edge to the left: the longer price holds, the further it reaches, full after six seconds. When price leaves it fades; back within four seconds, it picks up where it was.
It works for every level the book shows: your lines and rays, the VWAPs, an extended profile's lines, your alerts, and your trade's entry, stop and targets. It shows on Bitcoin, with Candle X-Ray and the book on.
Your levels
The drawing rail's Levels panel lists levels you saved before, by coin: rename them, see where they came from, remove them.
10Tools
Draw on the chart.
The pencil at the top left (or T) opens the drawing rail. Everything you draw is kept in your account, by coin, on every timeframe.
The tools
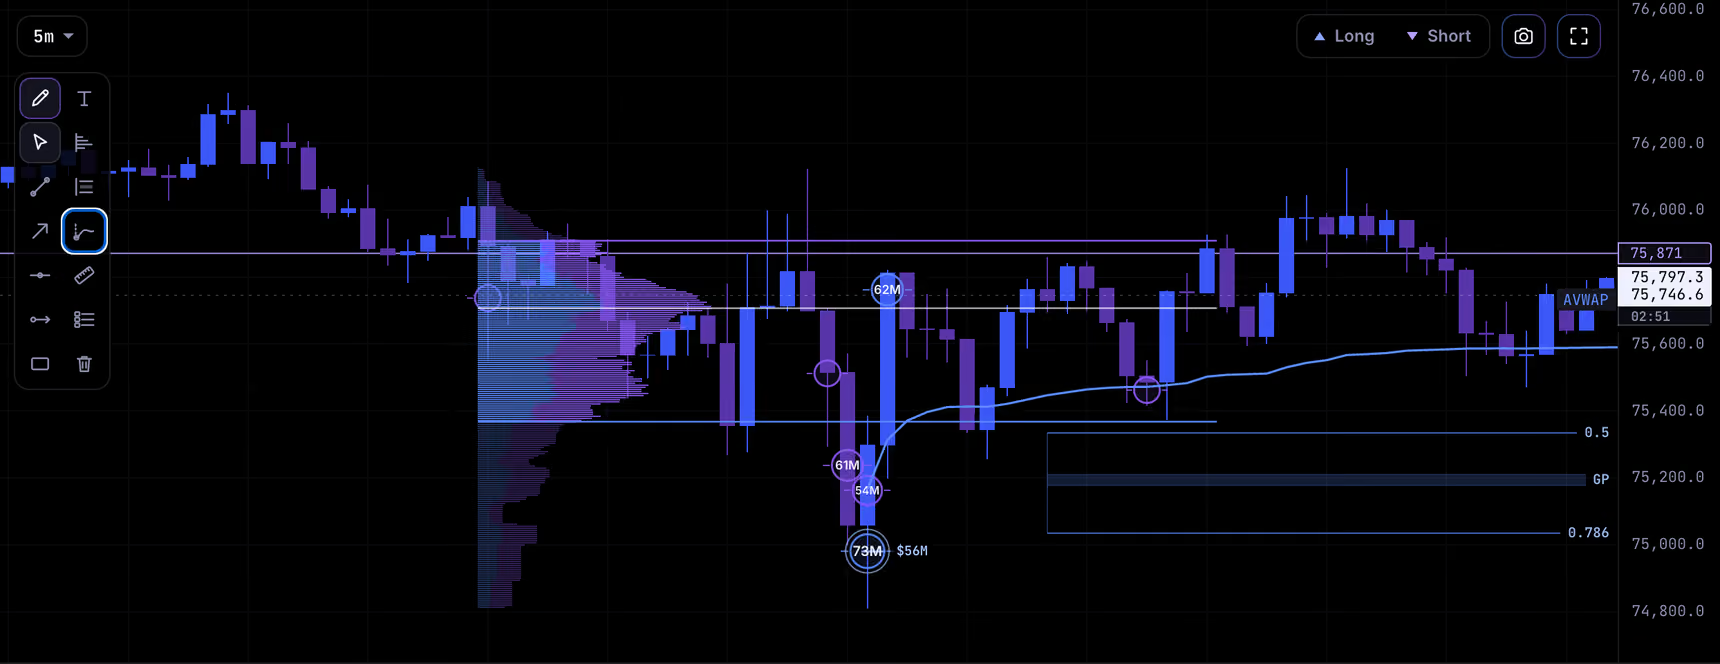
| ⌥T | Trend lineExtend it left, right or both ways from its bar. |
| ⌥W | Arrow |
| ⌥H · ⌥J | Horizontal line · horizontal rayBoth become rows in the book. |
| ⌥⇧R | Zone |
| ⌥V | Fixed range volume profile |
| ⌥G | Golden Pocket |
| From the rail | Text · Anchored VWAP · Levels |
| ⇧ + click | Measure$ and %, candles, time and volume between two points. |
Place, edit, remove
- Two-point tools: press and drag, or click twice. One-point tools: one click. The tool lets go after each drawing.
- Click a drawing for its handles and its bar: colour, its own options, and the bin. Drag an end, or the whole drawing.
- ⌫ removes the one selected; a note offers Undo for six seconds.
Golden Pocket and AVWAP
Golden Pocket: click a swing low, then a swing high (a long, in blue), or high then low (a short, in violet). It snaps to the wicks and draws 0.5, the pocket (0.618–0.65) and 0.786.
Anchored VWAP: click a candle; its bar adds ±1σ and ±2σ bands.
11Tools
Divergence, with a magnet.
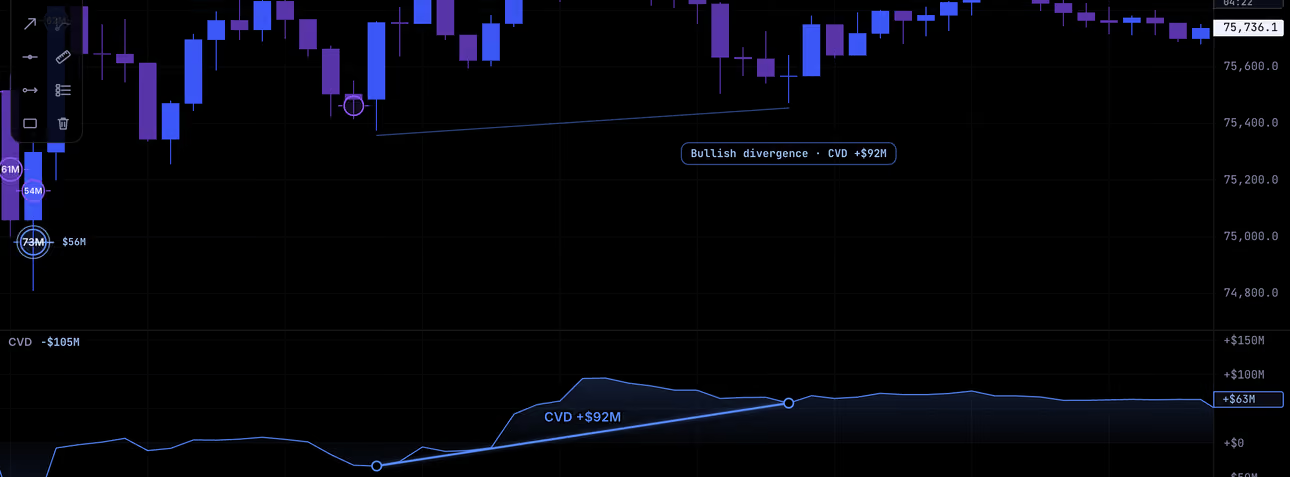
Draw a line on CVD, open interest or delta, and X-Ray reads it against price, then writes its verdict on the chart.
Draw one
- Arm the trend line: ⌥T. (Tools › CVD divergence is on from the start; it reads OI and delta too.)
- Drag on the CVD, open interest or delta pane, from near one low to near the next (or high to high).
The magnet snaps each end to the pane's low (or high) and finds price's matching wicks. To place an end exactly where you want it, hold ⌘ or ⌥Alt while you drag. The Magnet button in the line's bar turns it off.
The verdict
- Bullish divergence
- Price made a lower low, the flow a higher low.
- Bearish divergence
- Price made a higher high, the flow a lower high.
- No divergence
- They agree. A line from a high to a low gets no verdict.
- Panes disagree
- The flow panes point different ways.
The line's change shows on the pane (CVD +$92M); a hairline marks price's two wicks.
12ToolsPro
Alerts that find you.
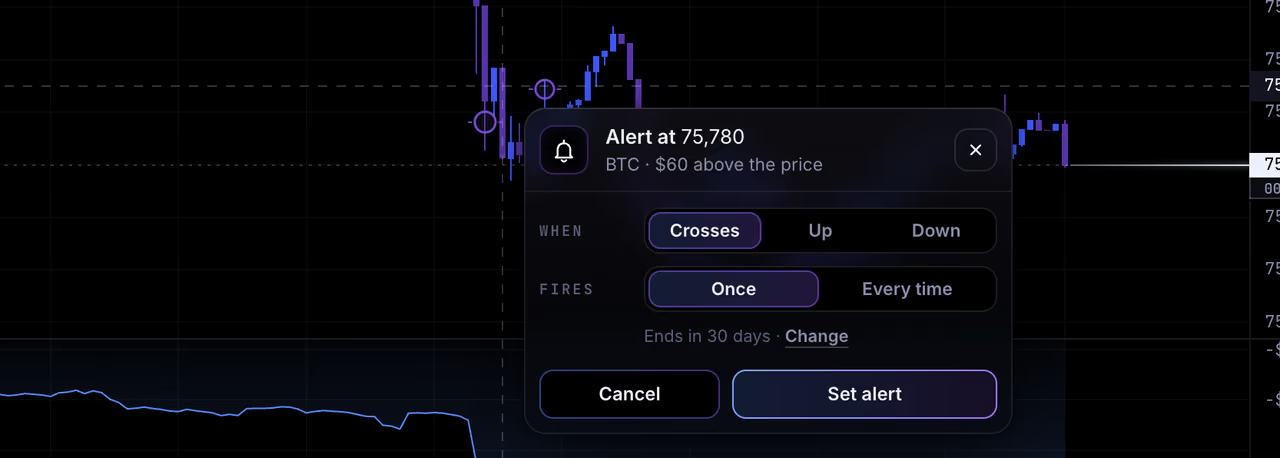
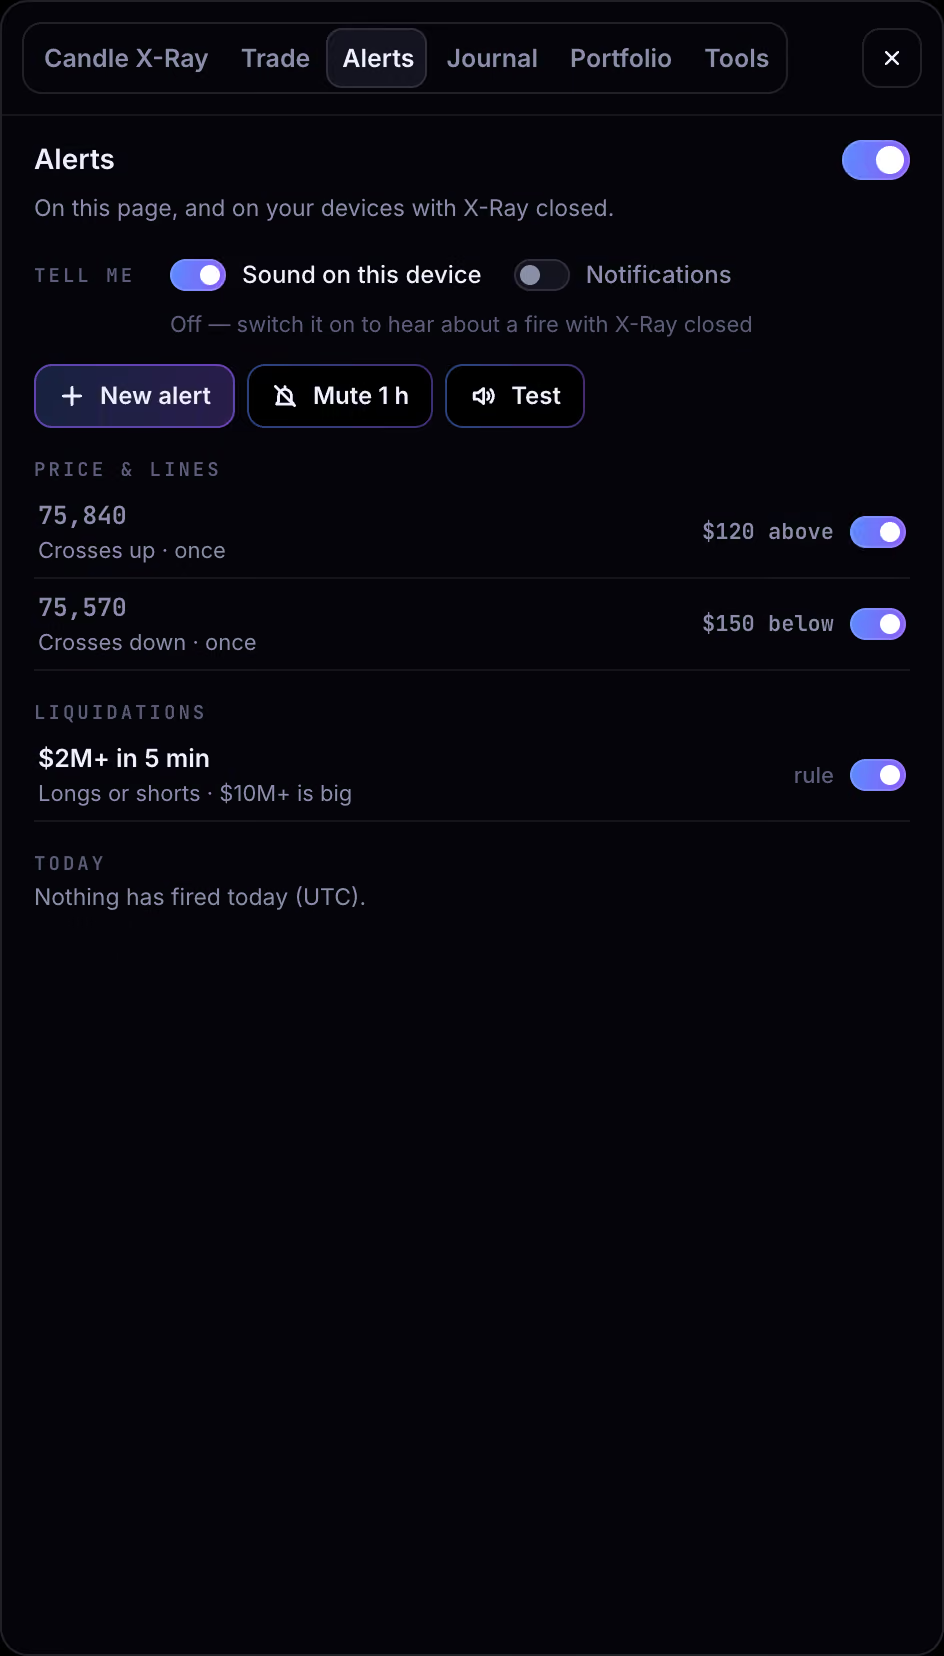
Set an alert at a price, on a line or on a level that moves, and X-Ray tells you when it is crossed: on the page, with a sound, and on your devices even with X-Ray closed.
Set one
- ⌥A sets one at the pointer's price; New alert in the Alerts tab (A) does too.
- Right-click the chart: Add alert at…, Alert on this line (a trend line you drew) or Alert on this profile.
- Click a profile's POC, VAH or VAL, or the daily VWAP, for an alert that moves with it.
On the card: When (crosses, up or down), Fires (once, or every time) and how long it lasts (30 days to start; tap Change).
What you can watch
- Price
- A price, or a line you drew.
- Moving level
- A profile's POC, VAH or VAL, or the daily VWAP, within $10 to $100.
- Liquidations
- Big liquidations in a few minutes.
- Walls
- Big walls near price.
Where it reaches you
A note in X-Ray with Again and Edit, a sound on this device, and notifications on your phone and computer even with X-Ray closed (switch Notifications on in the Alerts tab, on each device).
Good to know
- Alerts are Pro. Price and level alerts are on Bitcoin; a liquidations rule can watch any of the six coins.
- Up to 25 alerts and 5 devices. An “every time” alert waits at least 5 minutes between fires.
- A row's switch pauses it, or arms it again after it fired.
13TradePro
Link your exchange, with a trade-only key.
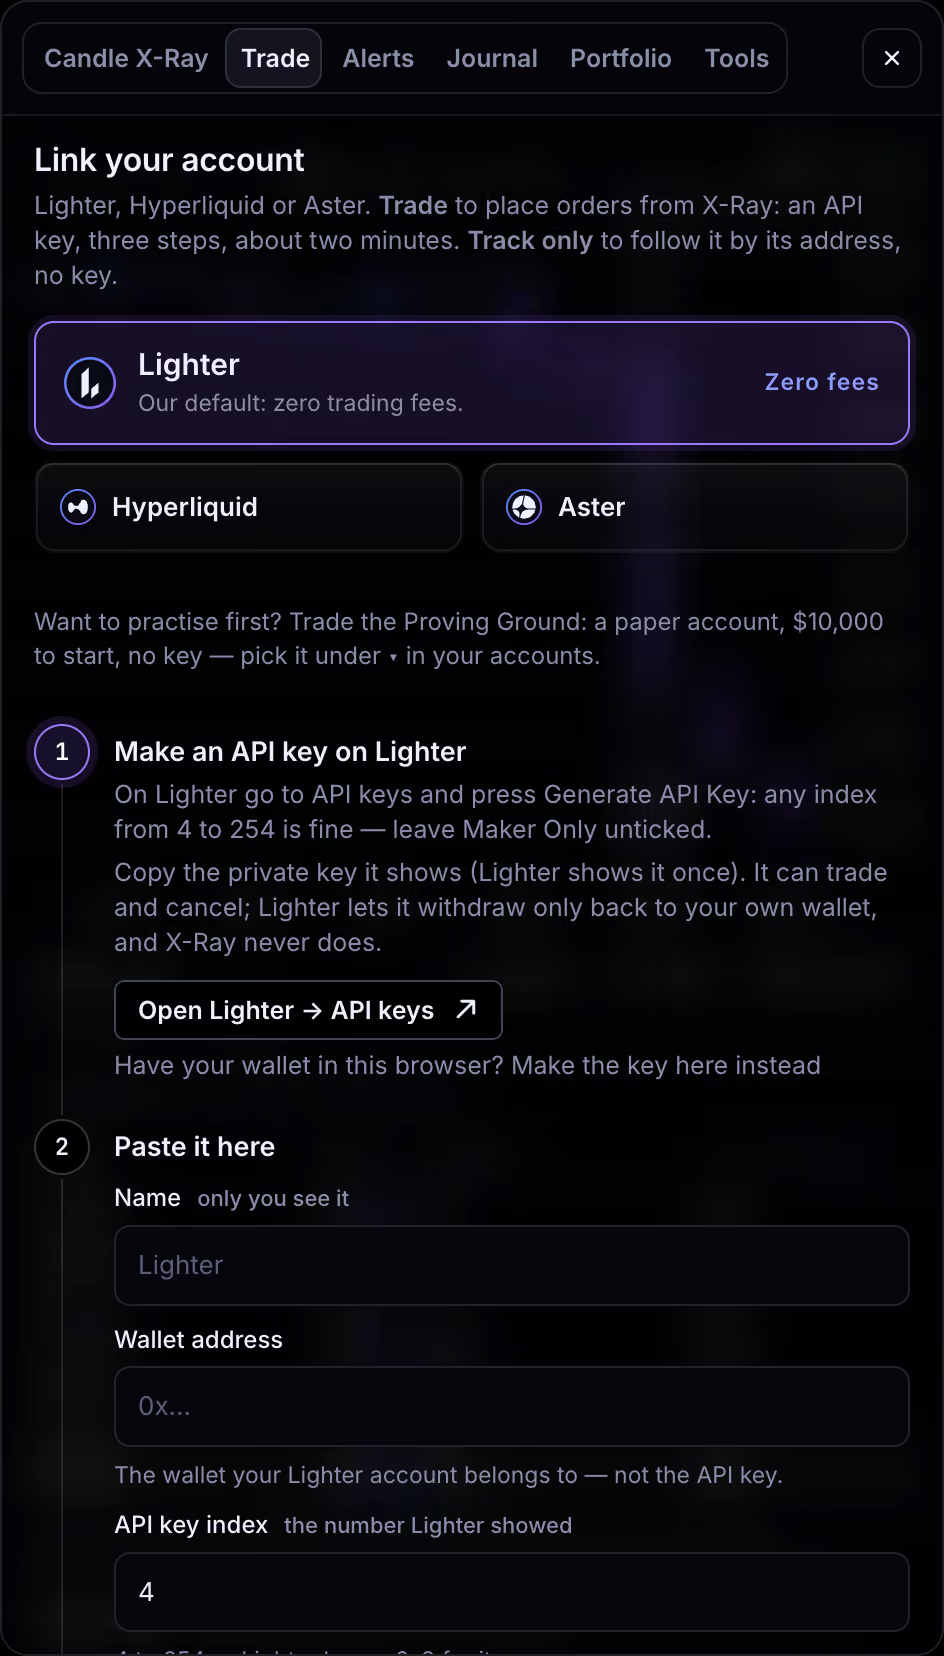
Trade from the chart on your own exchange account: Lighter (our default, with zero trading fees), Hyperliquid or Aster. X-Ray uses an API key that trades for you; your money stays in your exchange account, and X-Ray never moves it.
Lighter, in three steps
- On Lighter, open API keys and Generate API Key (any index from 4 to 254; leave Maker Only off). Copy its private key: Lighter shows it once.
- In X-Ray, Trade (D) › Link my account › Lighter: a name, the wallet your Lighter account belongs to (not the key), the key's index and its private key. X-Ray checks it against the key Lighter lists for that index.
- Seal & link with your passkey.
Or Make the key here instead: your wallet signs once and X-Ray makes the key (Sign & link). No Lighter account yet? The tile offers one with our link.
Hyperliquid or Aster
Hyperliquid: on More → API, make an API (agent) wallet valid for up to 90 days, then paste your account address and its private key. Aster: a Pro API key with Perps on, Spot off and Withdraw off; X-Ray refuses one that can withdraw or trade spot.
How your key is kept
- It is sealed on this device with your passkey; our server only ever gets a locked copy it can't open. Any of your passkeys unlocks it.
- It can trade Bitcoin. A Hyperliquid or Aster key can't withdraw; a Lighter key can only withdraw back to your own wallet, and X-Ray never does.
- Keep only trading money on that account.
Unlock to trade
Once a session, one touch of your passkey unlocks your keys; it isn't asked again for each order. Stay unlocked on this device: 15 minutes idle (the start), until you close the browser, or always on this device. Lock it on a shared computer: Lock now is in Tools › Trading.
Track only, and your keys
Track only (Hyperliquid and Aster) follows an account by its address: no key, no orders. ▾ › Manage keys renews, renames, makes one the default or unlinks it; unlinking leaves the key on the exchange until you remove it there.
Want to practise first? The Proving Ground needs no key.
14TradePro
The Strip or the Drawer.
Two ways to lay out trading. Pick one in Tools › Trading › Layout; this device keeps it.
The Drawer
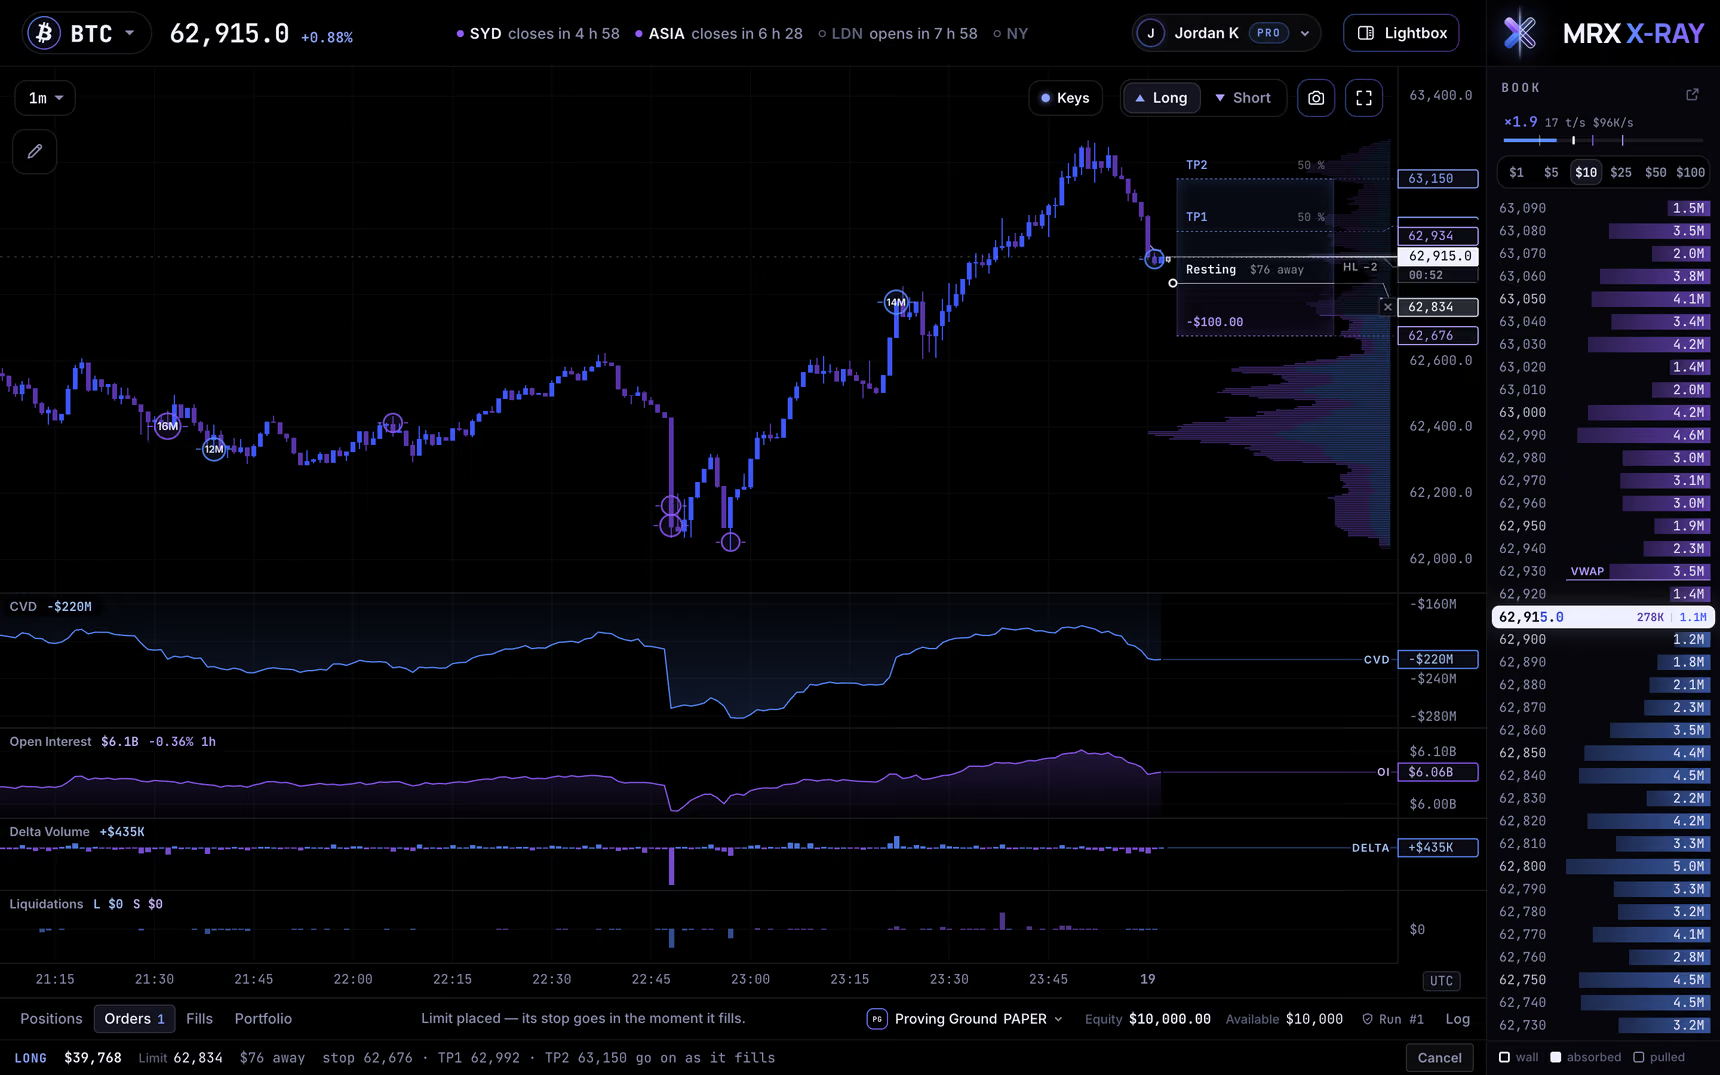
The Lightbox's Trade tab (D): your account (equity, available, margin), the position as a ladder of its prices with Stop → BE, Close ½ and Close, its targets, the smart stop, the ticket and the last day's fills.
The Strip
A band under the chart: Positions · Orders · Fills · Portfolio, your account, equity and what is available. The ticket rides on the box on the chart: risk, size and Send.
15Trade
Place a trade from the chart.
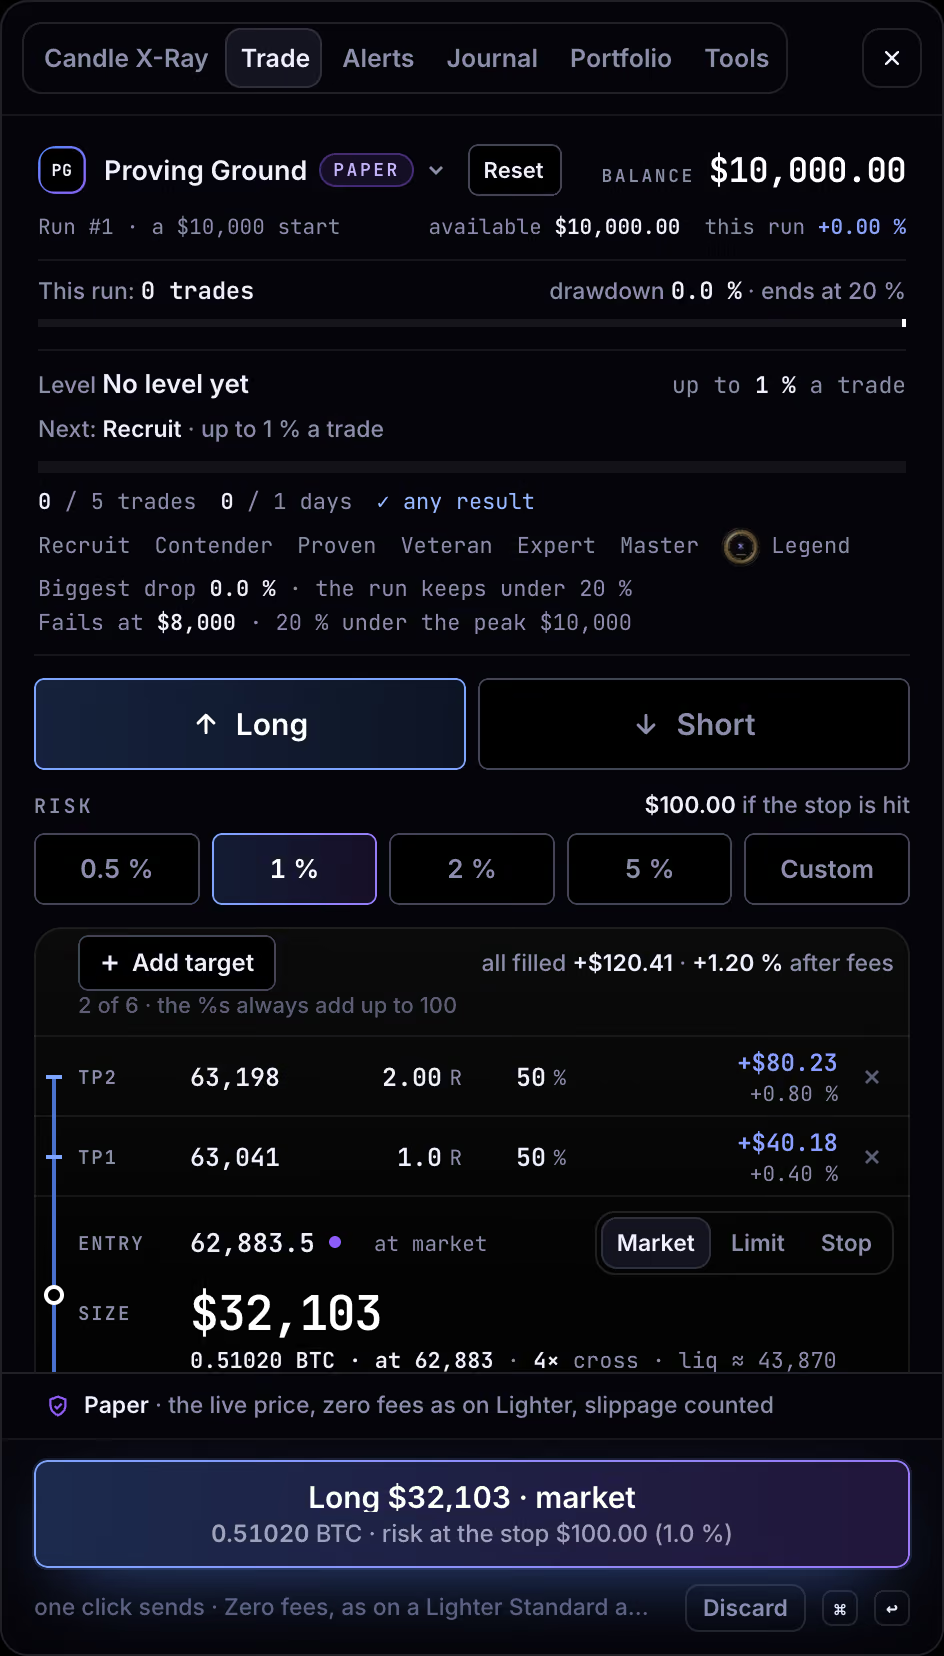
A long or a short is a box on the chart: its entry, its stop and its targets, each a line you can drag. X-Ray sizes it from the risk you pick, and shows it in dollars.
Step by step
- Press L for a long or S for a short (or the chart's Long and Short). A box appears at the price with its stop and two targets.
- Drag the entry: on the price it's a market order; to the better side, a limit; to the other side, a breakout (not on Lighter). Or use Market · Limit · Stop.
- Drag the stop. Every entry goes in with its stop.
- Pick your risk: 0.5, 1, 2 or 5 %, or Custom (0.1 to 10 %).
- Send: on a computer one click sends it (or ↩, Space, or L / S again). On a phone, a short press and hold, for now.
How the size is worked out
Your risk in dollars, divided by what a bitcoin would lose from the fill to the stop, fees included. You see it in dollars; type a size instead and it tells you the risk.
Targets
Up to six, each with its share of the position (they always add up to 100 %). Add target for another; × removes one. With none, you manage the exit.
Once the exchange takes your entry, its targets go on and stay on: if the exchange is busy, X-Ray keeps trying, shows targets going on, then Targets on, and never places one twice. If one still can't go on, it tells you to add it on the chart.
With Cold Capital
Tools › Trading › Size risk on: With Cold Capital sizes your risk on money you hold off the exchange too. Leverage and liquidation still run on what is on the exchange.
Instant orders
⇧L and ⇧S (or ⌘⇧L and ⌘⇧S): one press, a market order with its stop and target, from the profile in Tools › Trading › Instant orders.
Over 5 %
A risk over 5 % shows what two and five losses in a row would cost, and asks you to tick I know — let me place it. Ten percent is the cap.
16Trade
Manage it on the chart.
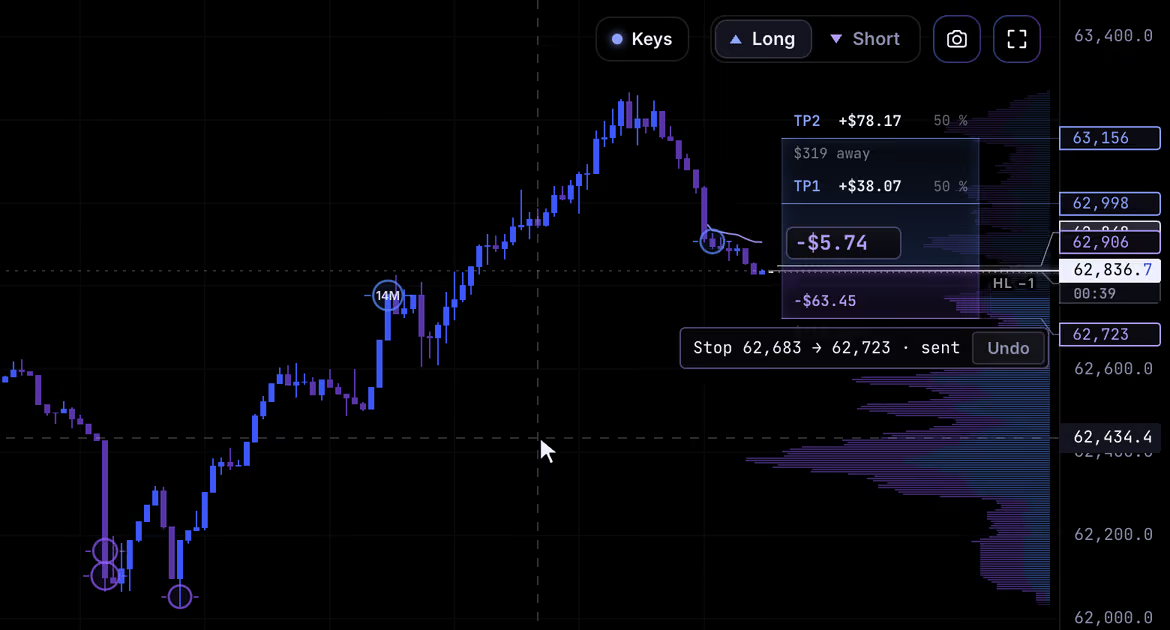
Your position's lines stay on the chart. Drag them, and the exchange gets the new price the moment you let go.
Drag a line
- A stop or a target: sent when you let go. Undo sits by the line for five seconds.
- A resting order: drag its entry, its stop, a target, or the whole box. The size stays; the risk follows the new prices. A plan not sent yet sizes itself again from your risk.
- Esc during a drag puts the line back.
One press, from the keys
- ⇧X closes it all at market (no position: cancels the resting order), ⇧H takes half, ⇧B moves the stop to break-even, ⇧F flips it: closed, then the same size the other way. ⇧C cancels a resting order.
- The same in the Drawer and the Strip: Close, Close ½, Stop → BE; and on a right-click (on a phone, a long press) on the chart.
- Change any key in Tools › Trading › Keys; the Keys switch by Long and Short turns them all off.
Guard rails
- A stop can't be dragged past the price (Close does that), and the last stop can't be cancelled.
- Cross margin, up to 40×; X-Ray won't place an order whose liquidation would come before its stop.
- One entry every two seconds.
Smart stop
In the Drawer: trail the stop by $ or %, by candles or swings, or step it up as targets fill. It runs while X-Ray is open and unlocked; close the tab and your last stop and targets stay on the exchange.
17Trade
Copy your own trades.
Copy my trades here repeats what you do on one Hyperliquid account on your others: another Hyperliquid account you linked, or the Proving Ground. It copies you, not anyone else.
Turn it on
Open the account list (▾ by your account in the Trade tab). Under each account that can follow, switch on Copy my trades here. The account you trade on leads; it shows Copying to…. This device keeps the switches.
How it sizes
The same side, type, prices and target split, at the same risk %, on each follower's own capital.
What it copies
- Entries (instant ones too), stop and target moves, limit moves and cancels, Stop → BE, and closes at the same fraction.
- Not fills or liquidations, and nothing you do on a follower itself.
If a copy fails
The leader never waits. The follower shows copy failed, with Retry or Skip. Lighter, Aster and track-only accounts can't lead or follow, and the Proving Ground can't lead.
18Trade
The Proving Ground: $10,000 of paper.
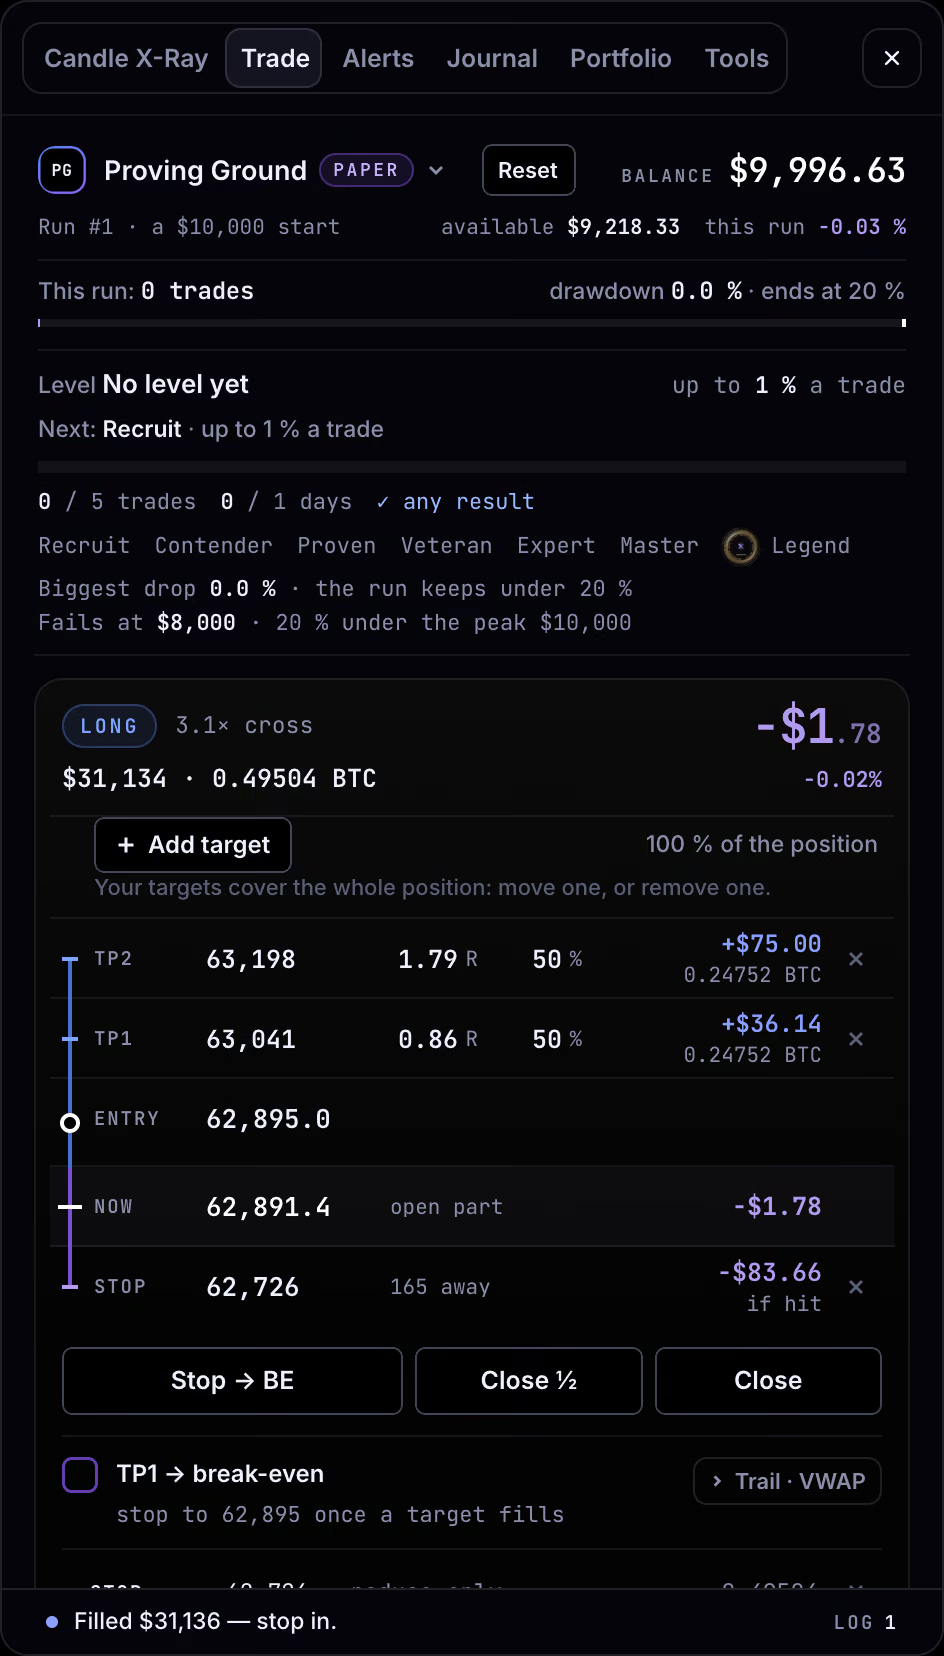
A paper account on the live price, with zero fees as on a Lighter Standard account. Free accounts get it too: practise every part of trading from the chart without risking a dollar, and climb its seven levels.
Open it
Trade (D) › Paper trade now, or ▾ › Proving Ground. One account per person.
Like the real thing
- $10,000 to start, and no fees, as on a Lighter Standard account.
- A market order fills at the price plus a little slippage (more on a bigger order); a limit fills once price trades through it; a stop fills at its price, or worse in a gap.
- If one candle touches your stop and a target, it counts as the stop.
Its rules
- Every entry goes in with its stop.
- Your risk cap is your level's: 1 % to start, up to 5 % at the top. After two losses in a row it halves, until a win.
- Up to 40× leverage, and liquidation never before your stop.
- A run ends if it falls 20 % under its best.
- Bitcoin only, for now.
Levels and runs
Seven levels, Recruit to Legend, each with its minimums: trades, days, profit and steadiness. Each level you reach comes with a certificate anyone can verify, and Expert, Master and Legend add months of Pro for members who have paid before. The levels and their rules.
Reset (tap it twice) starts a new run on a fresh $10,000. Your trades land in your journal, marked paper.
19Review
Your journal, and every trade replayed.
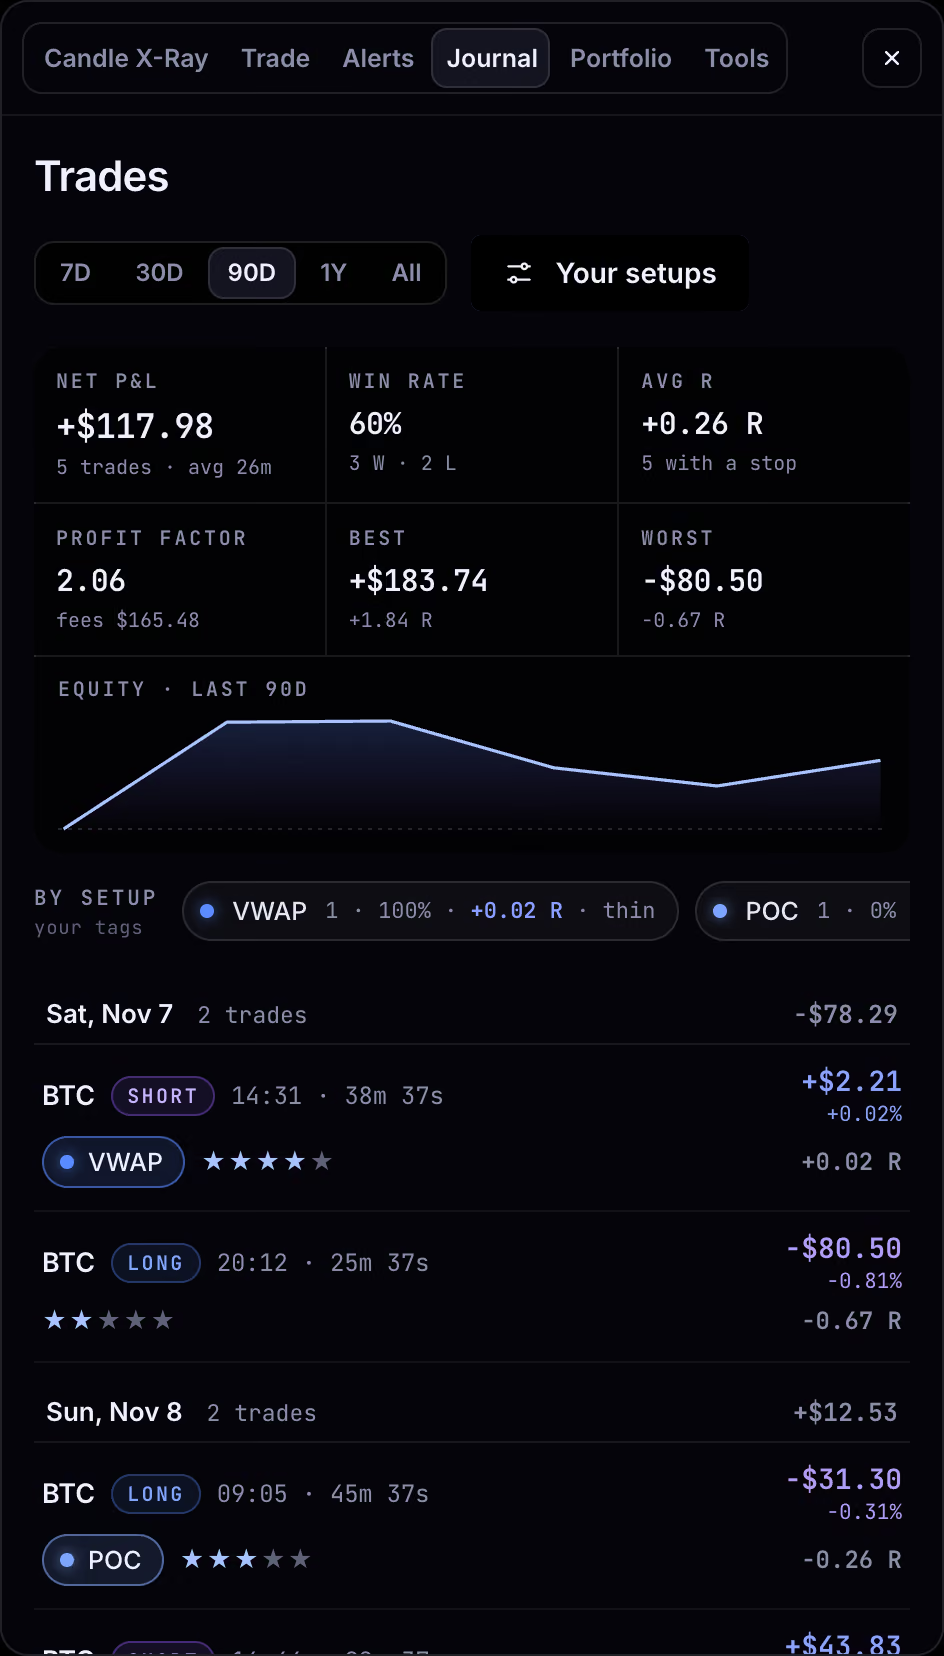
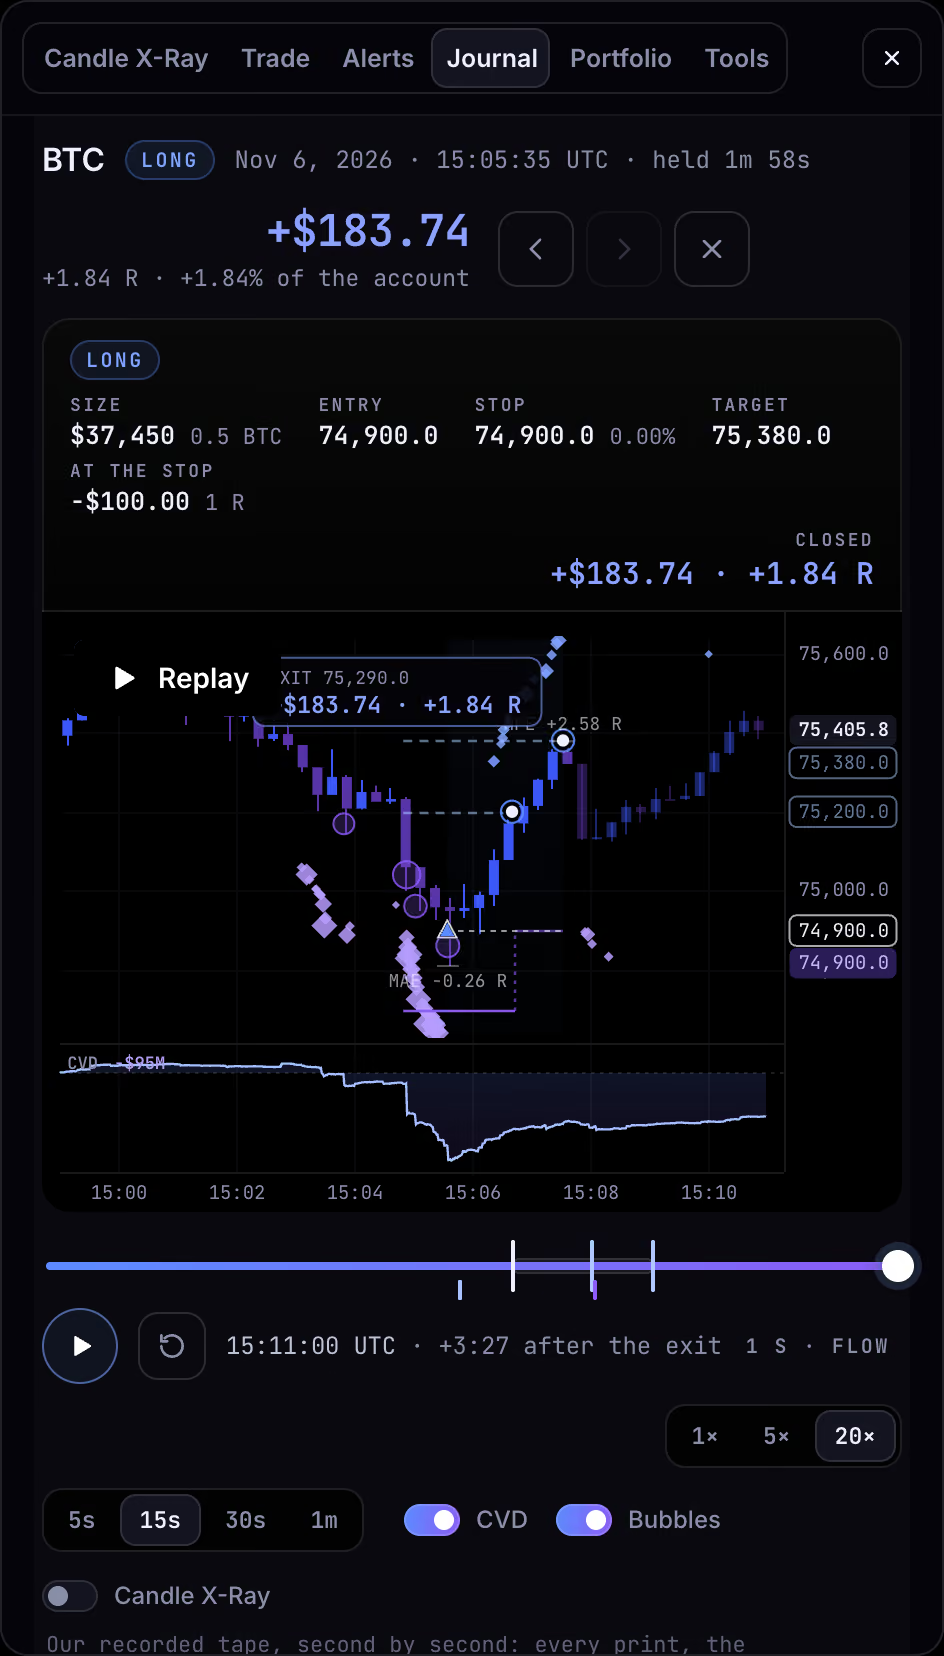
Every trade from your linked Lighter and Hyperliquid accounts lands in your journal by itself, read from the exchange's public trades (never with your key), with a replay of the real tape around it. Your Proving Ground trades land there too, marked paper.
What you add
Stars, your setups (each with your own rules to tick), mistakes, and a note. It saves as you type. Your setups keeps your list, with our suggestions.
Your numbers
Net P&L, win rate, profit factor, best and worst, and your equity line, over 7 days to all time. Tap a setup to see only its trades. Paper trades stay out of these numbers.
Replay a trade
- Click a trade, then Replay: the tape from five minutes before it to three after, at 1×, 5× or 20×.
- With the bar focused: Space plays or pauses, ← → step a candle, ⇧← ⇧→ jump to the entry or the exit.
- Switch CVD, bubbles and Candle X-Ray on it.
Share it
Share a closed trade as a Link, a Card, a GIF or an MP4. A win opens on the Replay card: the trade playing out, its big number as ROE, account % or dollars, and switches for the dollars, the leverage, your link and QR, and your Proving Ground level. Sizes for X, a square or a story; the GIF and MP4 run six seconds. Paper trades can't be shared.
Export your journal as CSV or JSON. The same trades are on your account page.
20Review
Share it, with your link.
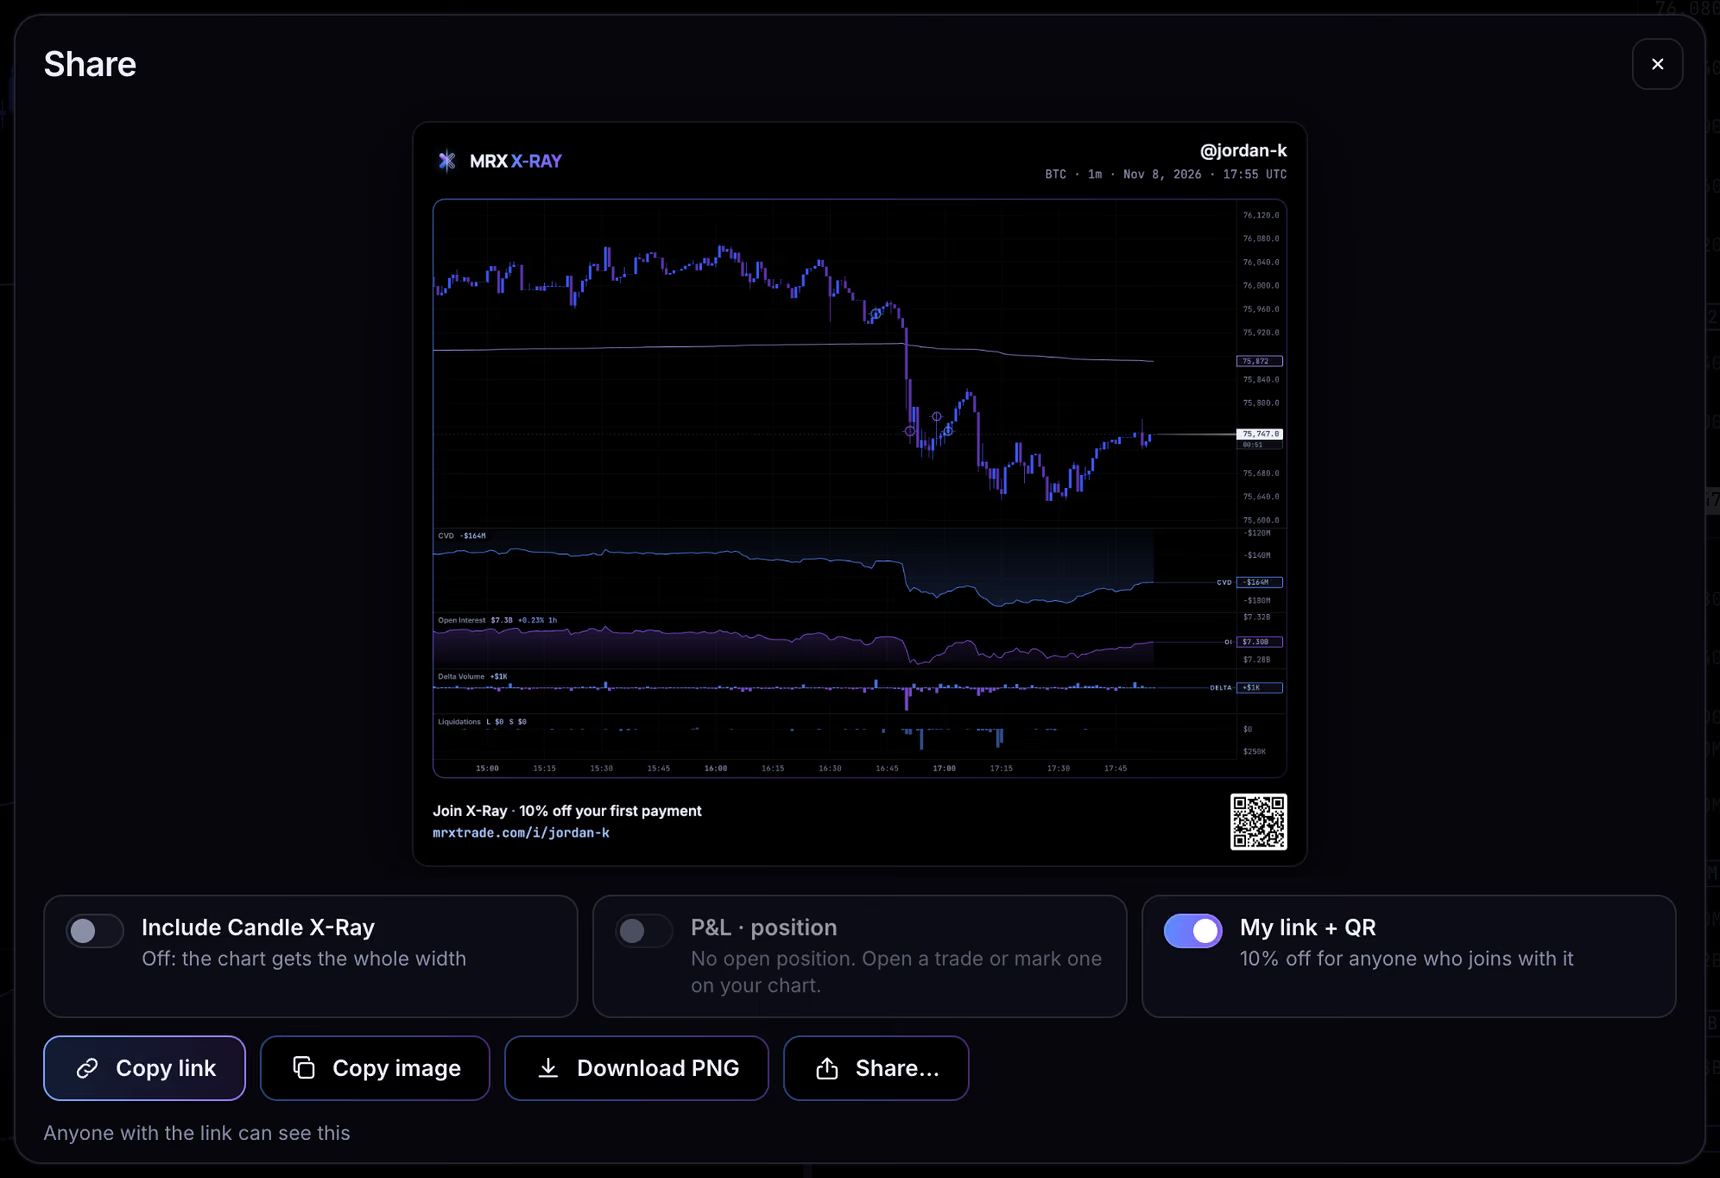
One tap makes a card of your chart with the X-Ray mark, your name and your own link, ready to paste into X or Discord.
Make one
The camera on the chart, P or ⌥S. Then Copy image, Download PNG, Copy link (a page anyone can open), or Share… where your device can.
Pick what shows
- Include Candle X-Ray beside the chart.
- P&L · position: only what you pick (side, move, entry and now, dollars, size, leverage).
- My link + QR: mrxtrade.com/i/your-handle.
Your link
Anyone who joins with it gets 10 % off their first Pro payment, and you earn a share of what they pay. How referrals work; change your handle on your account page.
21Reference
Every keyboard shortcut.
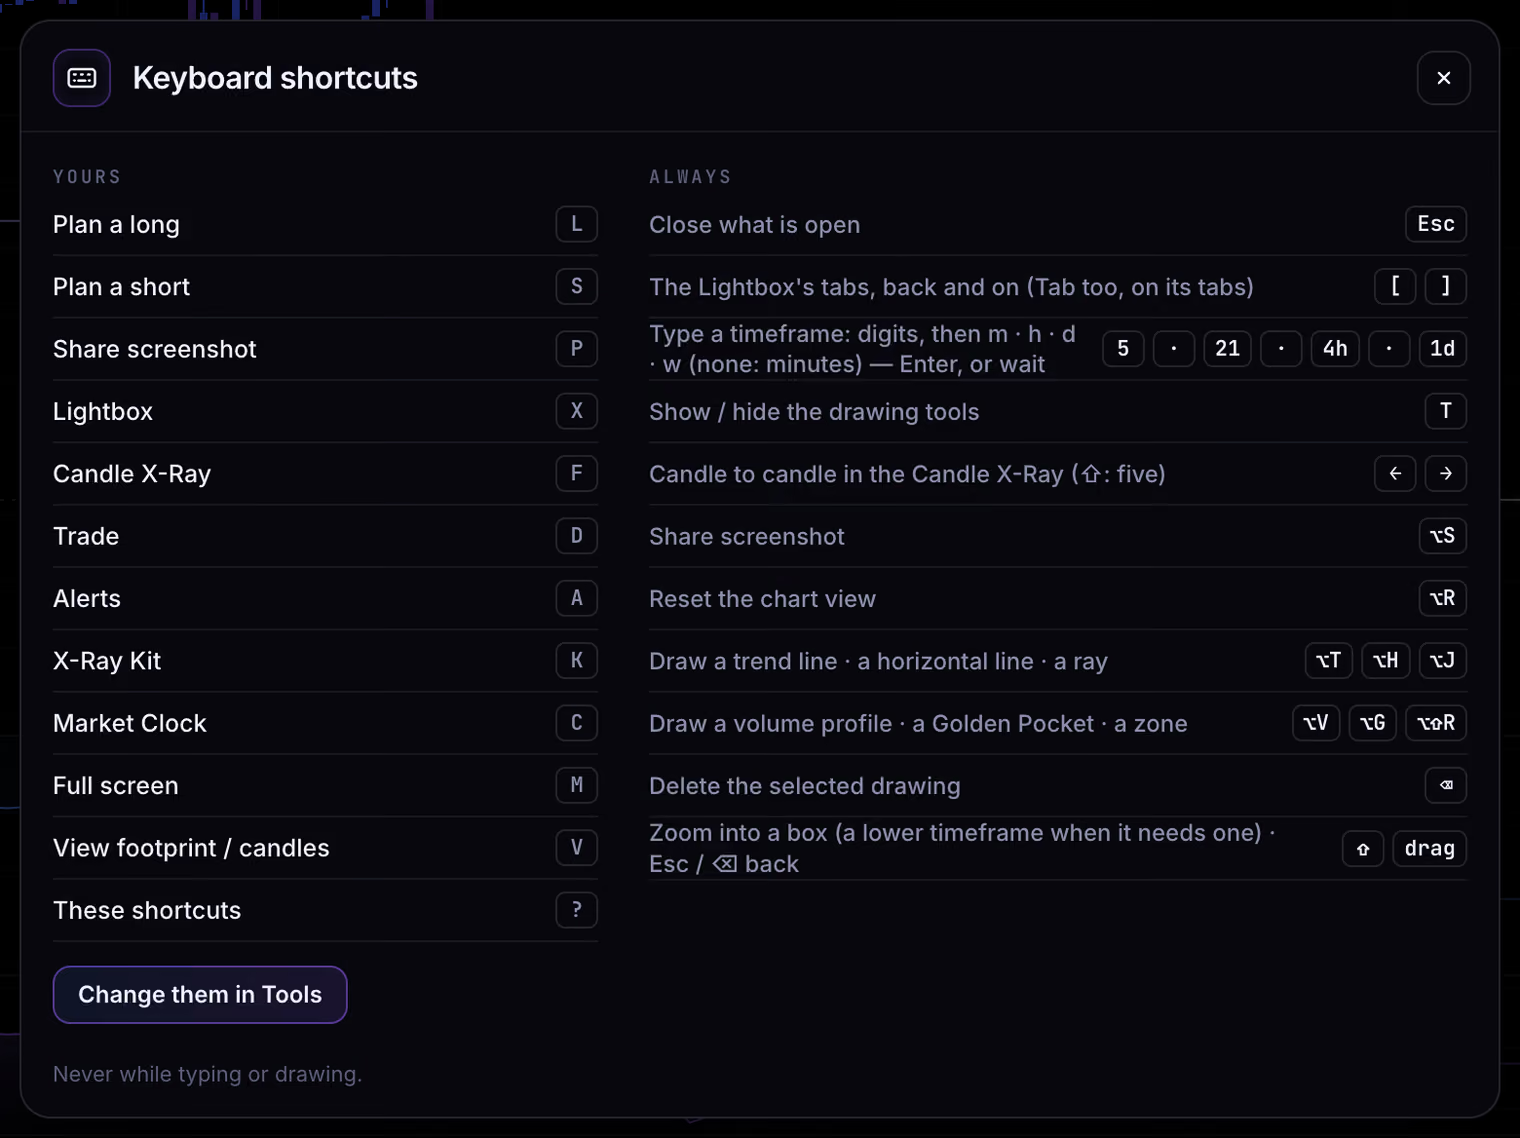
Press ? in X-Ray for the cheat sheet. Change your keys in Tools › Shortcuts, and the trading keys in Tools › Trading › Keys; none of them fire while you type or draw.
All of themMac or Windows
Panels
| X | The Lightbox |
| F | Candle X-Ray |
| D | Trade |
| A | Alerts |
| K | Tools (the X-Ray Kit) |
| C | Market Clock |
| M | Full screen |
| [ ] | The Lightbox's tabs, back and on |
| ? | The cheat sheet |
The chart
| 1–9 … | Type a timeframeThen m · h · d · w · s; Enter, or wait. |
| V | Footprint or candles |
| ⌥R | Reset the view |
| ⇧ + drag | Zoom into a box |
| Esc · ⌫ | One zoom back |
| ⌥ + click | Candle X-Ray on that candle |
| ← → | Candle to candle in Candle X-RayWith ⇧: five at a time. |
| ⌥X | X-Ray Read (Pro) |
Drawing
| T | The drawing rail |
| ⌥T · ⌥W | Trend line · arrow |
| ⌥H · ⌥J | Horizontal line · ray |
| ⌥⇧R | Zone |
| ⌥V · ⌥G | Fixed range profile · Golden Pocket |
| ⇧ + click | Measure |
| ⌫ | Remove the drawing selected |
| Hold ⌘ or ⌥Hold Alt while dragging | A divergence end placed freely, no magnet |
Trading and alerts
| L · S | Plan a long · a shortAgain: send it. The other one: flip the plan. |
| ↩ · Space | Send the planOnly while a plan is up. ⌘↩ too. |
| ⇧L · ⇧S | Long · short at market nowWith your instant stop and target; ⌘⇧L · ⌘⇧S too. |
| ⇧X | Close the position at marketNo position: cancel the resting order. |
| ⇧H · ⇧B | Take ½ · stop to break-even |
| ⇧F · ⇧C | Flip · cancel the resting order |
| ⇧ held | Show each line's × |
| ↑ ↓ | Nudge a ticket fieldWith ⇧: ten steps. |
| ⌥A | A new alert at the pointer |
| P · ⌥S | Share a screenshot |
Esc closes what is open, the most recent first. In a trade replay: Space plays and pauses, ← → step a candle, with ⇧ to the entry or the exit.
22Reference
Settings: all in Tools.
Every tool has its switch in Tools (K), the Lightbox's last tab. Your layout, settings and drawings are kept in your account and follow you to every device.
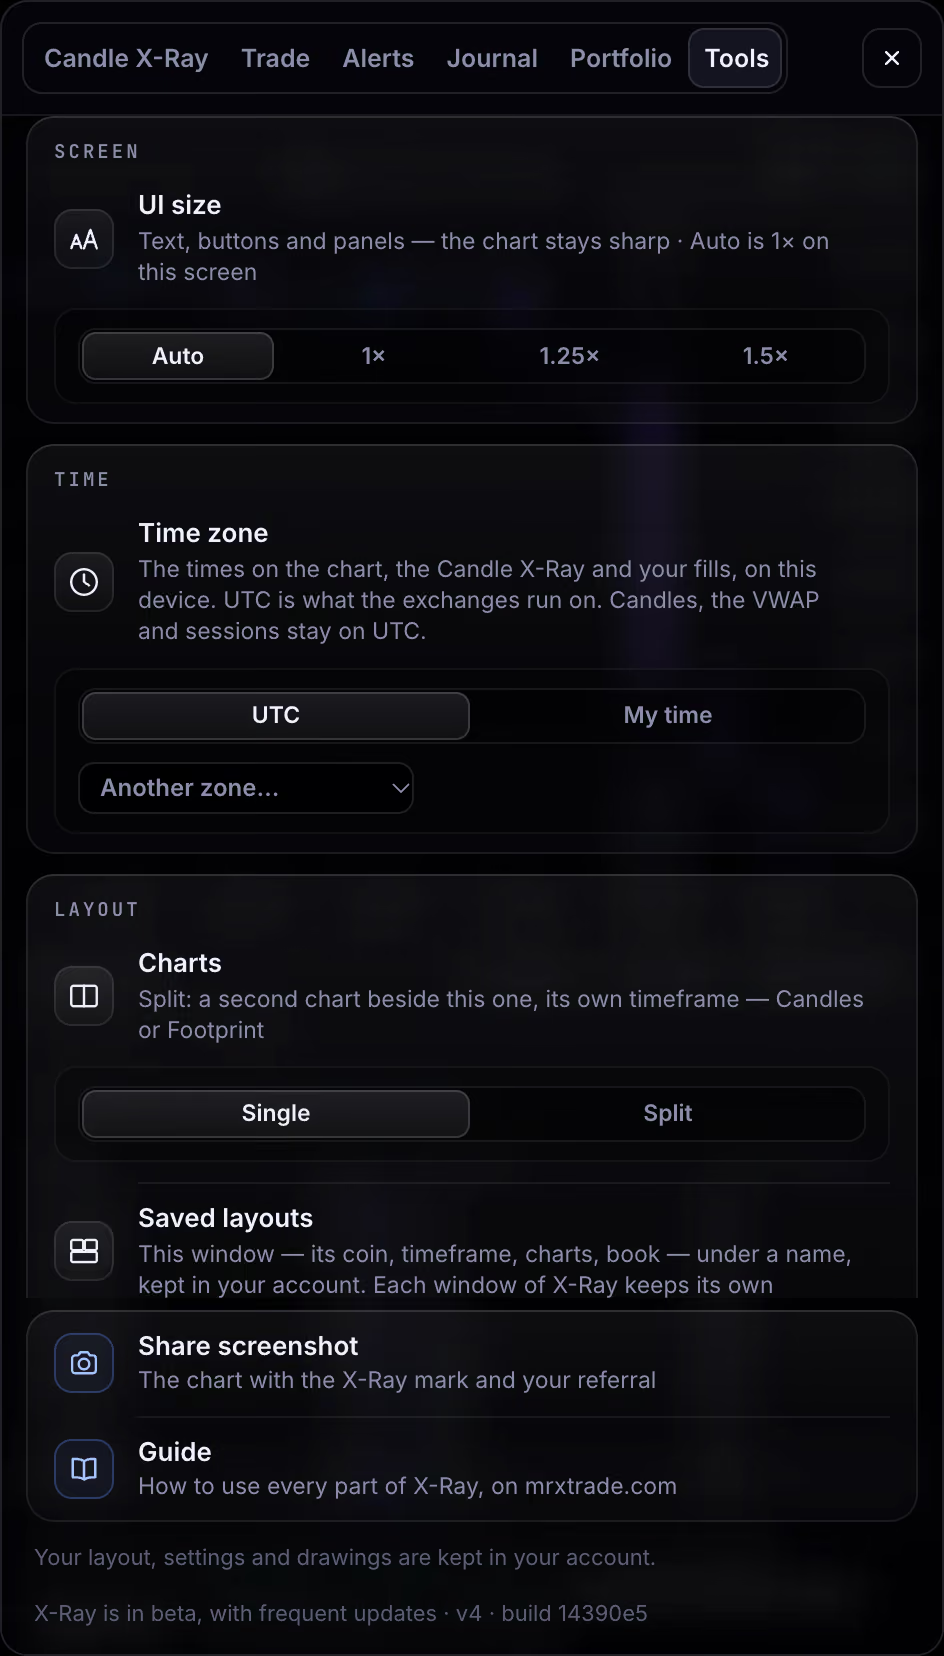
What is in Tools
- On the chart: bubbles (Prints) and walls, each with its minimum. Volume profile: the visible range.
- VWAP: daily, weekly, monthly. Panes: CVD, OI, delta, liquidations, CVD divergence.
- Panels: Candle X-Ray and its scan, the book and its row size, tape speed. Sessions and release lines.
- Screen: UI size (desk). Time: UTC, your time or any zone. Layout: split screen, saved layouts, pop-outs.
- Trading: Drawer or Strip, instant orders, size risk on, the trading keys, the fill sound, staying unlocked. Stream Deck (Pro). Shortcuts: your keys.
Kept on this device
UI size, the time zone, the split screen, the weekly and monthly VWAPs, the Lightbox, Candle X-Ray's Rolling or Candle, the Market Clock, the trading layout, its keys and options, and the sounds.
The rest
- Read the chart (⌥X): an AI read of the chart's flow, levels and scenarios. Pro, a number a day; a read, not an order.
- Sounds start after your first click or tap.
- Reconnecting by the price means the feed isn't answering; the chart keeps the last data and reconnects by itself.
Still stuck?
Ask us in the Discord.
Members and our team answer in the MRX Trade Discord, or write to support@mrxtrade.com. This guide explains the app; it isn't financial advice.